Selecting data in Excel with XLSTAT
This tutorial presents the different ways you can select your data in order to run an analysis in Excel with XLSTAT.
Goal of this tutorial
MS Excel users will find data selection with XLSTAT very intuitive whereas some of you who have been using other statistical software packages might not feel immediately at ease. This tutorial will show you how simple it is to work with XLSTAT and should help you save time.
Selection by columns
The column selection requires that your dataset starts on the first row of the Excel sheet.
It does not matter if the column or variable labels are stored on the first row, as the Labels included option displayed in most of the XLSTAT dialog boxes, allows you to specify it.
To quickly select a column, just click on the name of the column, as you would do with Excel. Then select the next columns by leaving the mouse button pressed and dragging the mouse cursor over the columns to select.
This mode is useful when columns correspond to variables and rows correspond to observations.
Note that you can select a range of non-adjacent columns. You simply need to press the Ctrl key of your keyboard while selecting the data with the mouse.
Selection by rows
The row selection requires that your data set starts on the first column (A) of the Excel sheet.
Click on the name (1, 2, …) of the first row of your data set on the Excel sheet, and then by selecting the next rows by leaving the mouse button pressed and dragging the mouse cursor over the rows to select.
This mode is useful when rows correspond to variables and columns correspond to observations. In this case, you need to activate the transposition option (see below).
Selection by range
Use the range selection mode when your data do not start on the first row.
Simply select the data in the corresponding cells using the mouse.
Selection from a list of variables
Click on the following button to change the data selection mode.
When the button shows a list icon (see below), XLSTAT will allow you to display a list of the available variables that you can select.
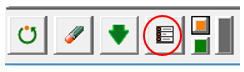
Simply select any cell on the Excel sheet your data are stored. Then launch the XLSTAT dialog box (e.g. ANOVA) and click on data field.
Selection from flat files
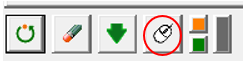
Click on the button as shown below to change the data selection mode.
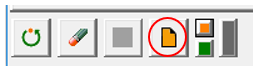
When the button shows an orange paper sheet, you will be able to import a flat file and display a list of the imported variables.
This mode is useful when your data contain millions of rows. See a more detailed tutorial on how to Run a linear regression on millions of data points in Excel.
War dieser Artikel nützlich?
- Ja
- Nein