Time-Intensity analysis in Excel
This tutorial will show you how to run a Time-Intensity analysis in Excel using the XLSTAT software.
Dataset for running a time-intensity analysis with XLSTAT
Goal of this tutorial
This tutorial uses a simulated dataset of Time-Intensity (TI) data as it would have been created after a Time-Intensity evaluation. In our example, the sweetness of two beverages, product A and product B, has been evaluated by a trained panel of assessors, Judge A, B and C during 2 sessions. Assessors were asked to score the perceived intensity of sweetness of the beverage through time. A data point was acquired every 2 seconds and the total duration of the measurement was 60 seconds.
Compared to single point measurements, the analysis of the development and decline of particular sensory characteristics may reveal rich information in order to distinguish products or perceptions. This type of analysis may be applicable to a variety of product, ranging from the level of sweetness of a beverage to the feeling left by a lipstick.
Setting up a time-intensity analysis with XLSTAT
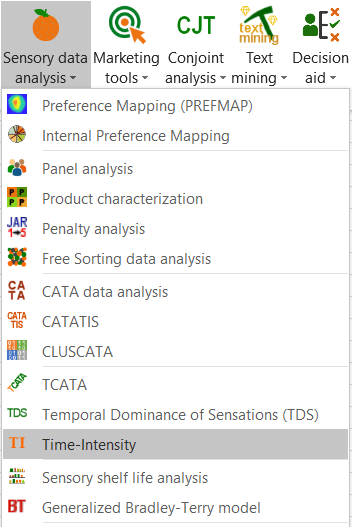
Once XLSTAT is open, select the XLSTAT / Advanced feature / Sensory data analysis / Time-intensity feature (see below).
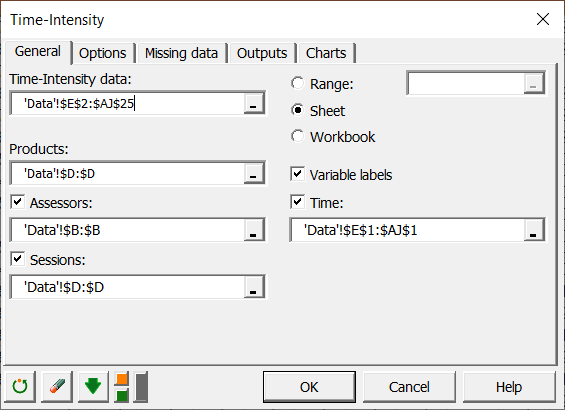
 The dialog box of Time-Intensity appears. First, select the Time-Intensity data and the Products identifier. Those 2 variables are mandatory to execute a TI analysis within XLSTAT. In our case, we also have identifiers for Assessors, Sessions and Time vector. So, you can activate the corresponding data fields and select data as indicated below. As there are labels for each variable, the Variable labels checkbox should be ticked.
 Let's go now to the Options tab to configure our TI method as shown in the picture below.
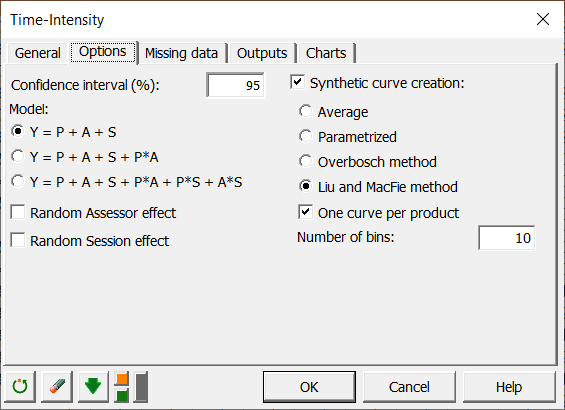
On the left side, 3 model configurations are proposed for the ANOVA to be performed on the extracted parameters. We chose the first one where no interaction between Product, Assessor or Session is considered. On the right side, you can activate the option synthetic curve creation and select Liu and MacFie method. As we wish to generate one synthetic curve per product, make sure the checkbox One curve per product is activated. Finally, the number of bins should be set to a default value of 10.
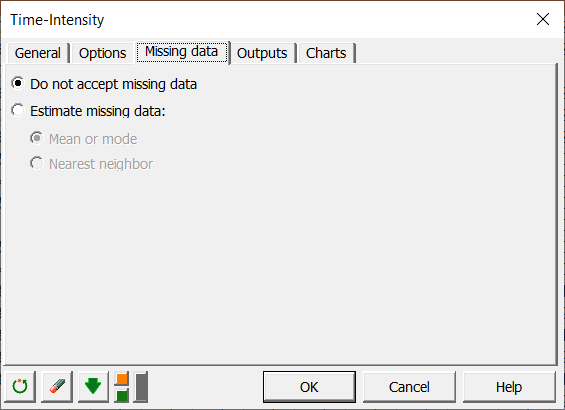
In the Missing data tab, we choose not to accept Missing Data as shown below.
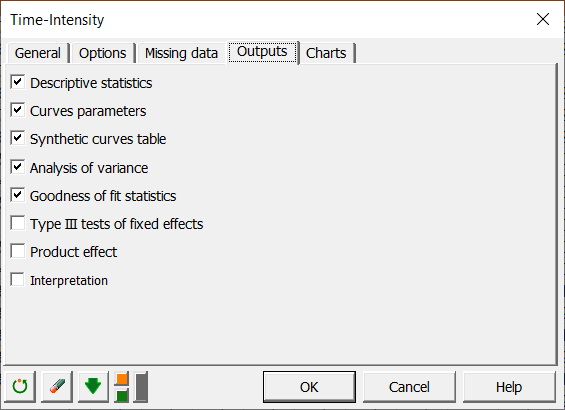
 In the Outputs tab, activate the options as shown below.
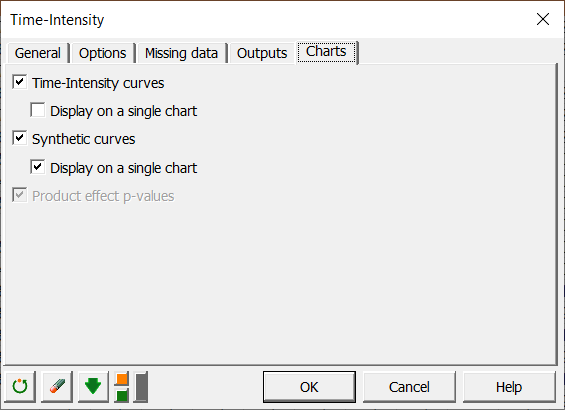
 And finally, in the Charts tab, activate the display of TI curves and the synthetic curves. Make sure also that the Display on a single chart is activated for the synthetic curves so that we can compare the resulting curve for the 2 products as shown below.
 Now, you can click on OK to start the computations.
Interpreting the results of a Time-Intensity analysis
On the result sheet, the first table displays descriptive statistics for the Product variable, the Assessors, and the session. As you can see below, each category of each variable is listed together with its frequency of appearance in the dataset. 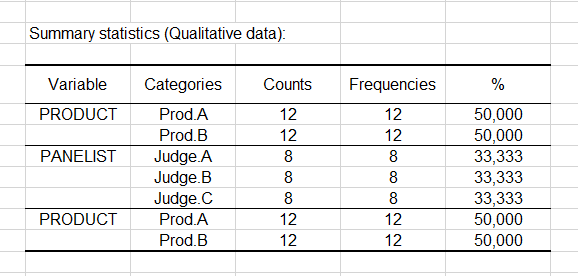
The next table shown below summarizes the measured curve parameters. Those are the 10 descriptive quantities measured on the 24 individual intensity curves. The table also indicates the corresponding Product, Assessor, and Session so that all the information is gathered in a single table. 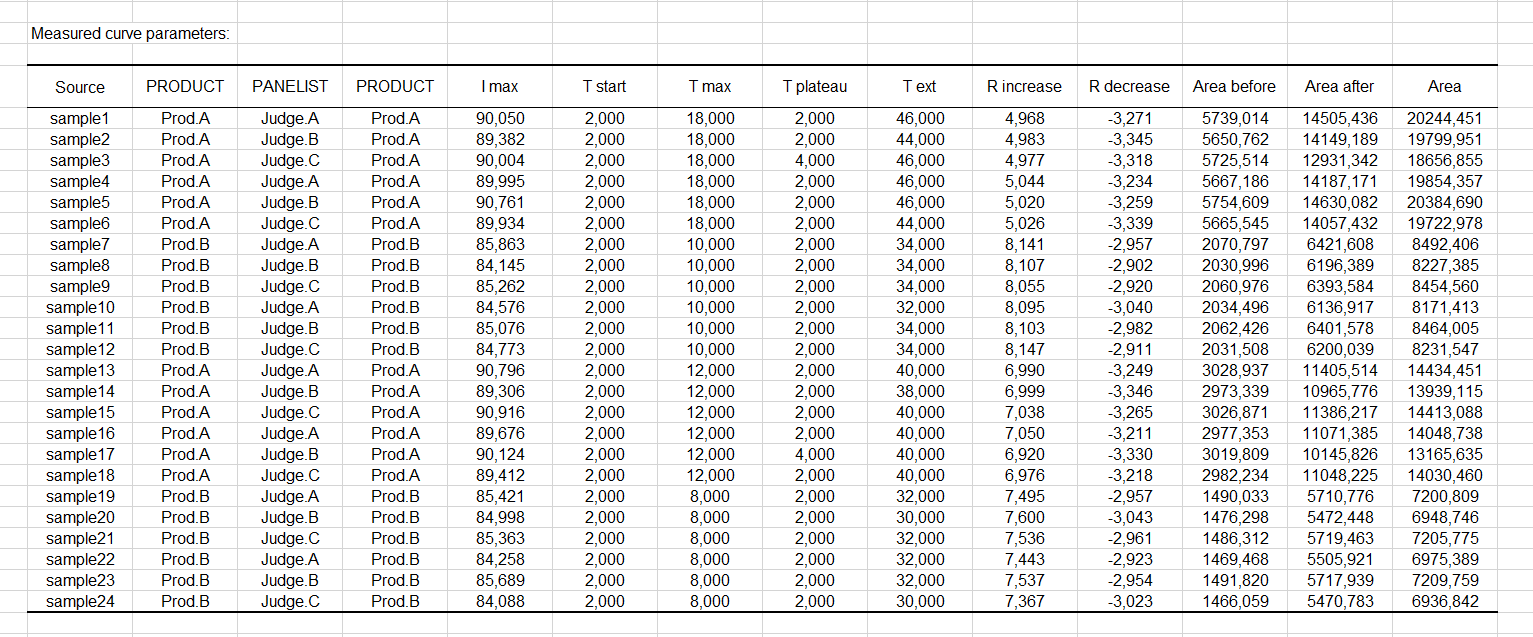
The parameter table is followed by a group of charts displaying the individual Time-Intensity curves shown below. Each curve is displayed on a single chart. It is important in a Time-Intensity analysis to visually control the individual TI curves. The user should use its field expertise to identifies potential recording issues. 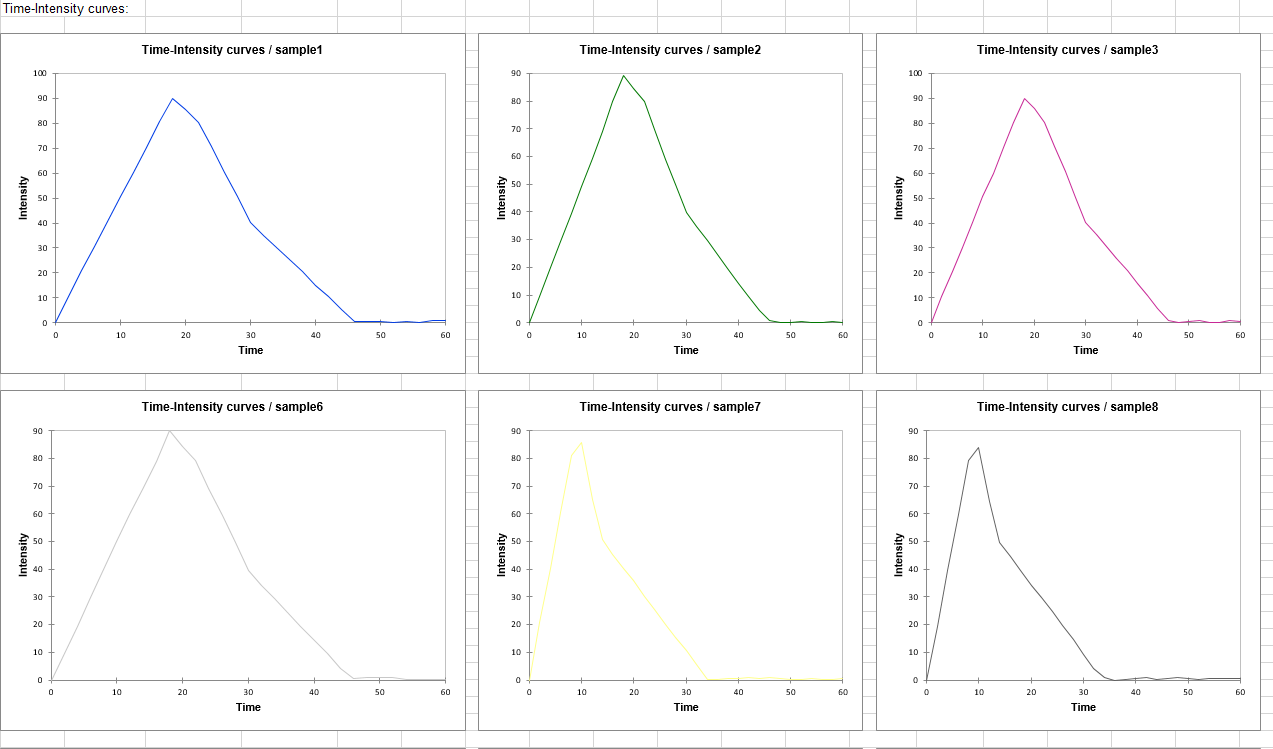
The table that follows is the synthetic curve table. As shown just below, it gives the intensity and time coordinate of both synthetic curves, the one for the product A and the one for the product B. 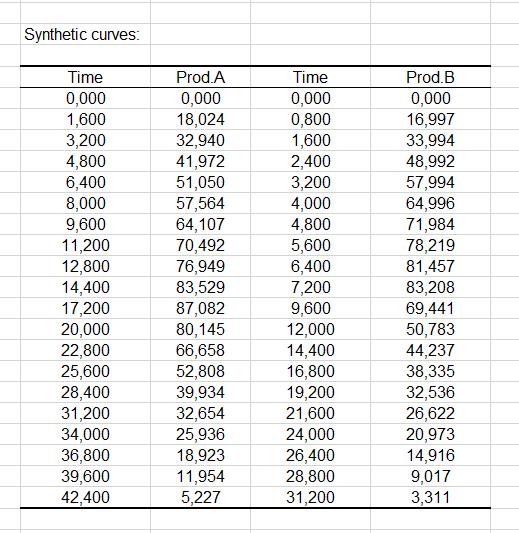
Those 2 synthetic curves are displayed in the graph that follows. 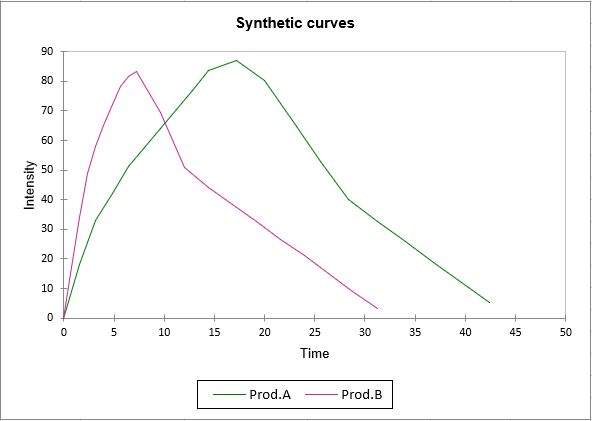
Finally, a list of ANOVA with each parameter considered as the dependent variable is displayed. For instance, you can see below that the T start variable was found to be constant. It does not bring any information to distinguish between products and has been rejected from the analysis. 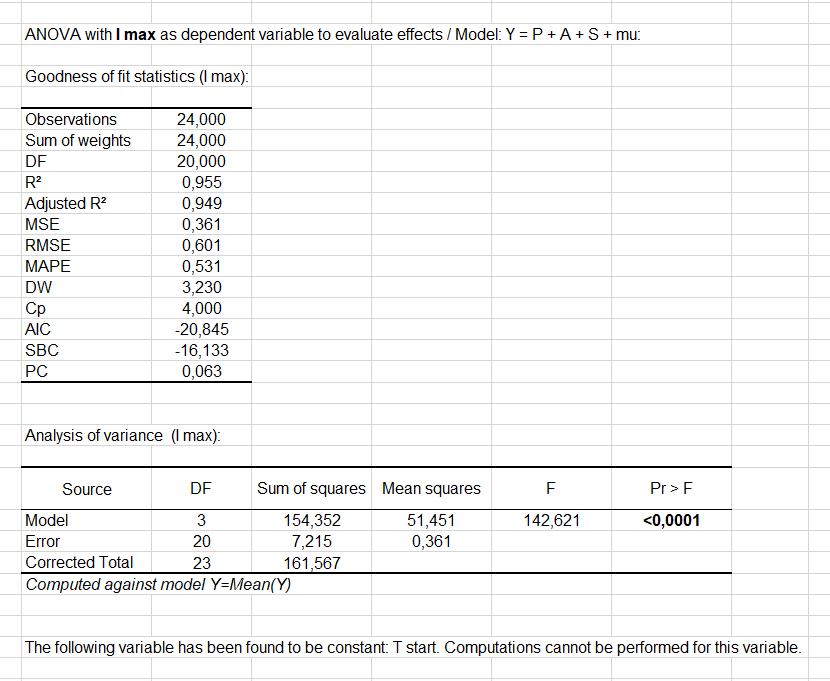
Conclusion
Using the XLSTAT statistical software, we were able to perform of Time-Intensity analysis on a simulated data set. The measured curve parameters were extracted by the algorithm and we could control that the individual TI curves were all fine. We also generated a synthetic curve following the approach proposed by Liu and MacFie and compare the results for both products.
War dieser Artikel nützlich?
- Ja
- Nein