Visualize crosstab tables using 2D plots in Excel
This tutorial shows how to generate a 2D plot for a cross table in Excel using the XLSTAT software
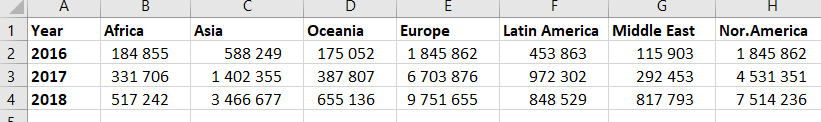
Dataset to generate a 2D plot for a cross table
Our data table contains sales amount of a company by year (rows) and by continent (columns). This type of table is called a crosstab or a contingency table or pivot table. Data are fictitious and were created for this tutorial.
Goal of this tutorial
Cross tables can summarize a large amount of information. In our case, a long list of orders by year and by continent. Visualizing this cross table will help us to quickly detect where the company sells the most as well as to explore the evolution of sales by year. See below how to achieve this in few clicks.
Setting up a 2D plot for a cross table in XLSTAT
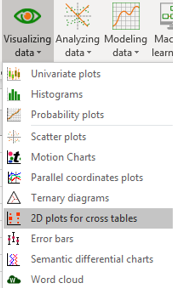
Select the Visualizing data / 2D plots for cross tables command in the XLSTAT menu.
 The 2D plots for cross tables dialog box appears.
 In the General tab, select the Cross table format. Enter the title of the plot in the Display title field. Check the Labels options since our data table includes row and columns headers.
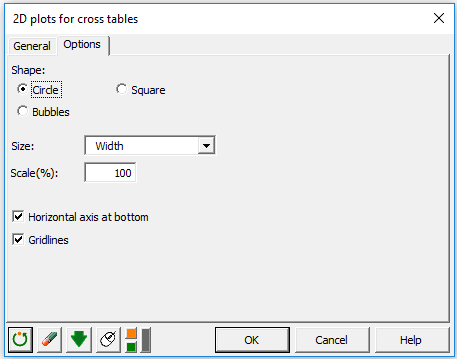 In the Options tab, choose the Circle option. Points within the plot can be also represented by squares or bubbles. The area of the points is proportional to the values. Finally, choose to display the horizontal axis at the bottom of the chart.
Once you have clicked on the OK button, a 2D plot is generated into a new sheet, called 2D view.
Interpreting a 2D plot for a cross table
In a single graph, we can observe the evolution of sales within three years from one continent to the other.
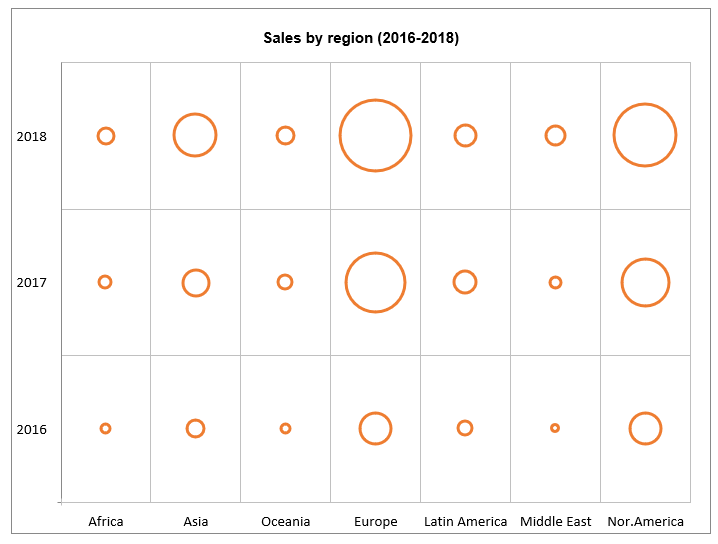 Globally, the sales revenue increased from 2016 to 2018 (5M vs 23M). The company clearly managed to increase sales within Asia, Europe and North America while the rest of regions stay relatively stable. Finally, we can observe that the majority of sales occured in Europe and North America. In particular, 74% of the total sales have been recorded for these two regions.
War dieser Artikel nützlich?
- Ja
- Nein