Kernel density estimation in Excel
Setting up the kernel density estimation feature in XLSTAT
-
Open XLSTAT.
-
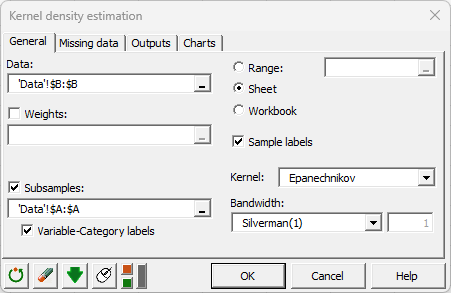
Select the XLSTAT/ Describing data / Kernel density estimation. The dialog box pops up.
-
In the XLSTAT interface, select the "HEIGHT" column in Data to analyze the athletes' height density.
-
Select the "SEX" column within the Subsamples segmenting insights based on athletes' gender for a more detailed examination.
-
Select the "Epanechnikov" Kernel.
-
Select the "Silverman (1)" method to define the Bandwidth.
-
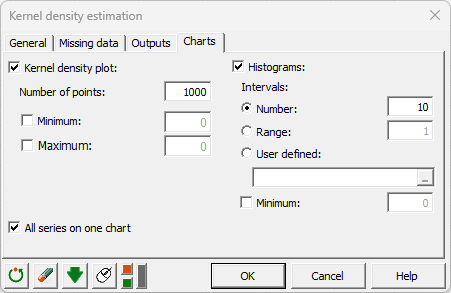
In the Charts tab, activate the All series on one chart option
to effectively compare subsamples. -
Click on OK.
 Interpreting the results of the kernel density estimation
Explore the XLSTAT chart below, showcasing density curves and histograms for the "HEIGHT" variable among male and female athletes.
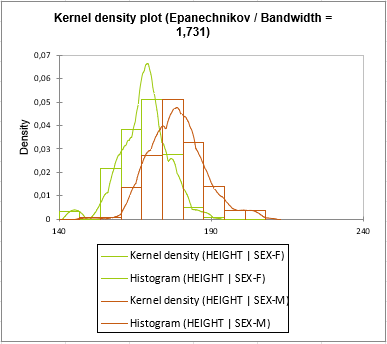
Kernel density estimation provides a smooth curve that represents the distribution of data. Analyzing the shape and width of these curves enables insightful comparisons between genders, unveiling unique data patterns.
Observing two distinct peaks for each group reveals crucial insights: women predominantly cluster around 170cm, while men peak around 180cm. This disparity signifies that, generally, athletic men tend to be taller than athletic women. Notably, the curve representing men's height extends beyond the one for women, further confirming this height difference between genders.
Was this article useful?
- Yes
- No