Probability plot tutorial in Excel
This tutorial explains how to create and interpret a probability plot in Excel using the XLSTAT software.
Probability plots is an old method (Hazen, 1914), that has been extensively used, especially through the use of printed probability paper. It is useful to visually control whether a sample follows a given distribution.
Dataset to create a probability plot
The data represent the final math scores of 1000 students collected in different schools. We would like to know the percentage of students who obtained a score higher than 17. For this purpose, we will use the XLSTAT function Probability plot in order to a) evaluate the distribution of the sample and b) detect the desired percentile.
Setting up a probability plot in XLSTAT
Select the XLSTAT / Visualizing data / Probability plots command. 
Once you've clicked on the button, the Probability plot dialog box appears.
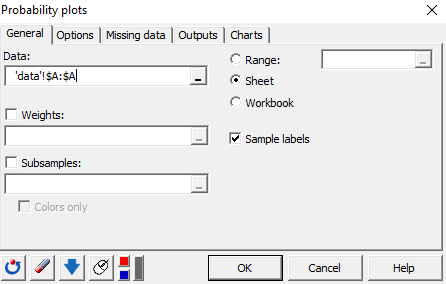
In the General tab, select the first column from the data sheet in the Data field. Select the Sample labels option to take into account the header of the column.
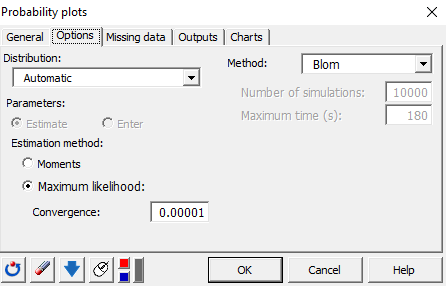
In the Options tab, choose the Automatic distribution so that the distribution that fits best can be automatically chosen by XLSTAT. There are different methods for estimating the parameters of the distribution and the plotting positions. For more details, click on the Help button.
Interpreting a probability plot
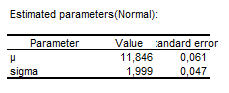
The first result displayed is the fit summary. The distribution that fits best the data is the one with the highest p-value (=0,736) thus the Normal distribution. The p-value is greater than the significance level alpha=0,05 implies so one cannot reject the null hypothesis that the sample follows a Normal distribution 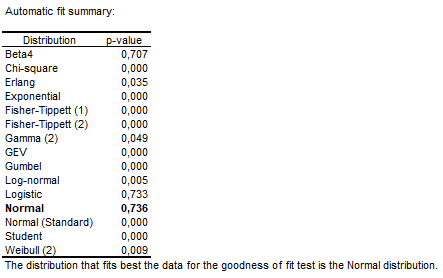 The next table contains the estimated parameters of the fitted normal distribution (mu = 11,8, variance = 1,9).
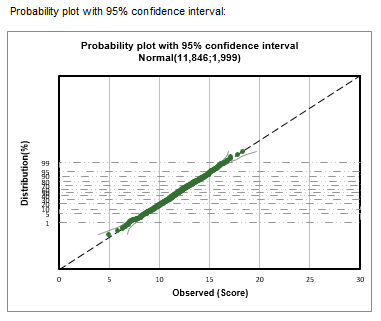
Based on the probability plot, we observe that the score 18 is at approximately the 99th percentile. Thus, we may suggest that 99% of the students obtained a score equal or less than 17, and only 1% of the students obtained a score higher than 17.
Was this article useful?
- Yes
- No