Probability Calculator in Excel tutorial
This tutorial shows how to compute a probability density function, a cumulative distribution function, or an inverse cumulative distribution function in Excel using the XLSTAT software.
What is a probability distribution?
A probability distribution is a special type of function, that is named a measure in mathematics. It allows to relate random events to their probability. A random event can be the occurrence of a 2 when throwing a die, the arrival of two customers to a post office at the same time, drawing a King from a well-shuffled deck of cards and plenty other ones.
A large number of probability distributions have been developed to describe particular situations where randomness occurs. Randomness is a representation of ignorance or imperfect knowledge. When you roll a die, a perfect knowledge of the starting movement allows you knowing when, where, and in what position the die would stop. Nevertheless, it is so complex that it is preferable to estimate that each face has a certain probability of being the result of the throw and that the occurrence of an event is random. Click here to read more.
Goal of this tutorial
One counts the number of emails received at work each day during a certain period. Let’s assume that the occurrence of this event follows a Poisson distribution with an average rate (labda) equal to 5.
Based on this information, we want to compute:
- The probability to receive 10 emails in a day.
- The probability to receive between 3 and 6 emails in a day.
- The number of emails received such as the probability to receive this amount is 0.8.
We will also visualize the probability density function.
Setting up the Probability Calculator in XLSTAT
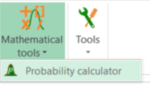
Select the XLSTAT / Mathematical tools / Probability Calculator command (see below).
 The Probability Calculator dialog box appears.
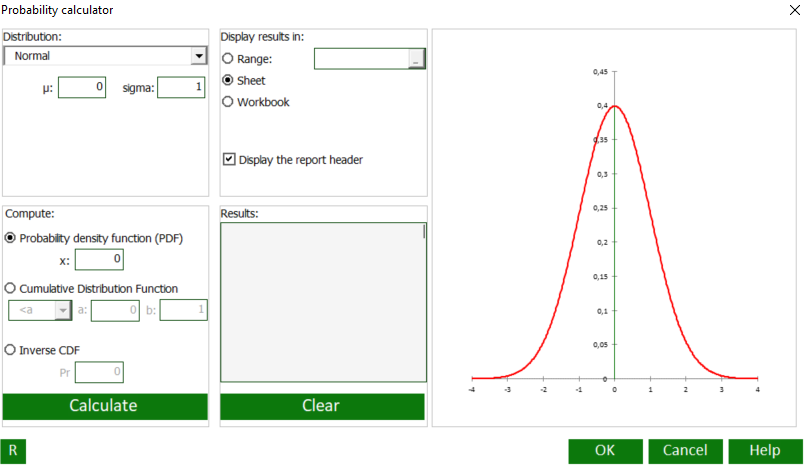 On the left-hand side of the dialog box, choose your distribution, enter the parameters and choose whether you want to compute the density function, the cumulative distribution function (CDF) or the inverse CDF.
In the middle part of the dialog box, choose where you want to display the output and visualize the computed probability within the interface.
On the right-hand size of the dialog box, visualize the distribution function.
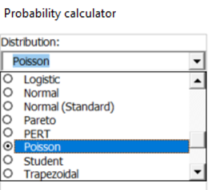
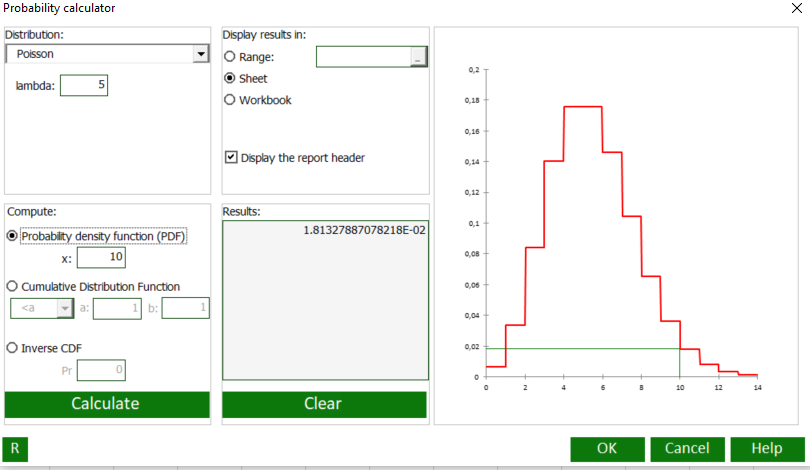
Start by selecting the Poisson distribution from the drop down list.
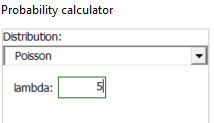
 Then enter the value 5 in the lambda field which correponds to the average number of received emails per day. Lambda is the event rate, also called the rate parameter.
What is the probability to receive 10 emails in a day?
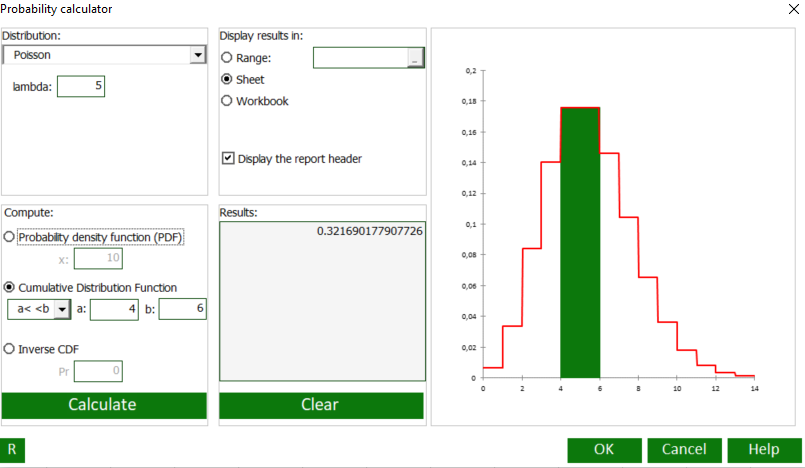
What is the probability to receive between 3 and 6 emails in a day?
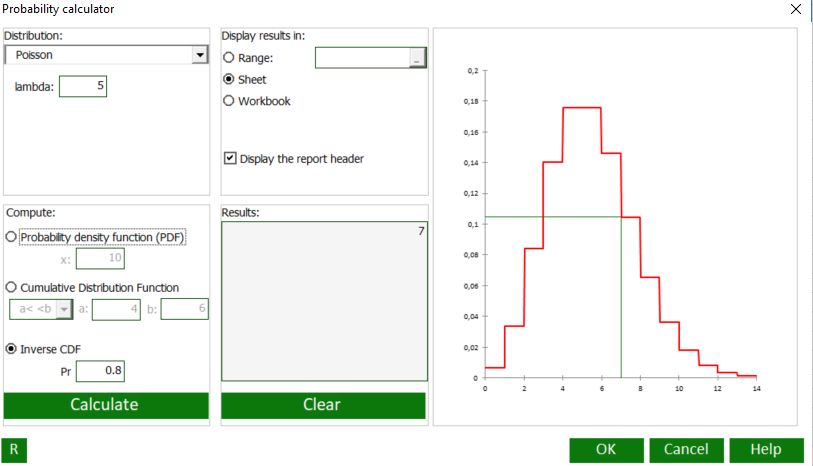
Which is the number of received emails in a day such as the probability to receive this amount is 0.8?
Was this article useful?
- Yes
- No