Pairwise multiple comparisons after a multi-way ANOVA
This tutorial will help you better understand multiple comparisons procedures, with an application in a two-way Analysis of Variance (ANOVA) context in Excel using the XLSTAT software.
Dataset for running pairwise multiple comparisons after a multi-factor ANOVA
The data correspond to a sensorial test on 2 food products. 4 assessors have tested both products and gave grades on 2 characteristics: taste quality and sweetness. Every product was tested 6 times by each assessor within different tasting sessions. The data was artificially generated.
Goal of this tutorial
The aim of this tutorial is to focus on multiple pairwise comparisons, also called post hoc comparisons, and which are often performed following parametric or nonparametric tests. We investigate the issue with a sophisticated example involving two 2-way ANOVAs including the two-way panelist x product statistical interaction. If significant, this interaction reflects contrasted differences between the grades of the two products across panelists. For example, some panelists may have graded product A higher than product B, whereas others may have given product B a better grade than product A. Multiple pairwise comparisons performed at the level of the interaction could help us identifying precisely what panelist belongs to the first group and what panelist belongs to the second.
A few words on multiple comparisons tools
After detecting that a factor has a significant effect on a dependent variable globally, we often want to go further into detail and ask which specific factor levels differ from one another. For example, we may test the effects of a factor involving 4 medical treatments on blood pressure. Running a one-way ANOVA on the data would answer the very general question: “is there at least one treatment which significantly differs from the others?” If the ANOVA test is significant, another question could be asked: “what treatments differ from one another?” This question requires testing the differences between all pairs of treatments. Pairwise multiple comparisons tools were developed to address this issue.
Pairwise multiple comparisons tools usually imply the computation of a p-value for each pair of compared levels. The p-value represents the risk that we take to be wrong when stating that an effect is statistically significant. The higher the number of pairs we wish to compare, the higher the number of computed p-values, and subsequently the risk of detecting significant effects which are not significant in reality. Considering a significance level alpha of 5%, we would likely find 5 significant p-values by chance over 100 significant p-values. Consequently, multiple pairwise comparisons tools involve p-value corrections: p-values are penalized ( = their value is increased) as their number grow.
The choice of pairs of factor levels to be compared depends on the question we are asking and should thus be done while planning for a study. Indeed, we are often interested in comparing all levels with one another. In this perspective, XLSTAT provides different methods including the Tukey HSD (Tukey Honest significant difference) procedure, which is, along with Fisher LSD, one of the most commonly used procedures in pairwise multiple comparisons. Newman-Keuls’s SNK method is also famous and available in XLSTAT, although it is not very reliable because it is weakly conservative. The REGWQ method is among the most reliable tests, although not widely used.
In other situations, we only seek to compare every level with a control. Selecting this subset of pairs decreases the number of computed p-values and subsequently their penalization. In that case, we talk about Dunnett contrasts, which are also available in XLSTAT. More personalized pairs may also be specified through contrasts.
Before proceeding with this tutorial, you may be interested in taking a look at a very simple case of multiple comparisons following a one-way ANOVA in XLSTAT.
Running pairwise multiple comparisons after 2-way ANOVAs
We will run pairwise multiple comparisons following two 2-way ANOVAs including an interaction between the factors.
Open the XLSTAT menu and click on XLSTAT-Modeling data / ANOVA.
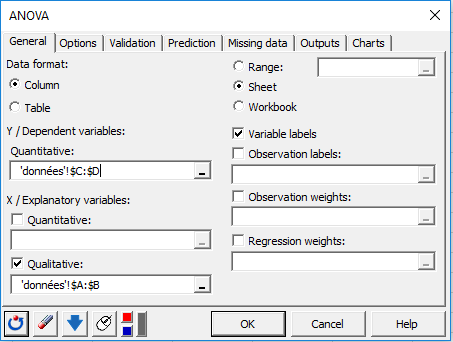
 In the General tab, select the Taste and Sweetness columns as dependent variables, and the Panelist and Product columns as explanatory qualitative variables. In the Options tab, activate the Interactions / Levels option, and select 2 level interactions so that the Panelist x Product statistical interaction is taken into account. In the Outputs / General tab, make sure you activate the Type I/II/III SS option.
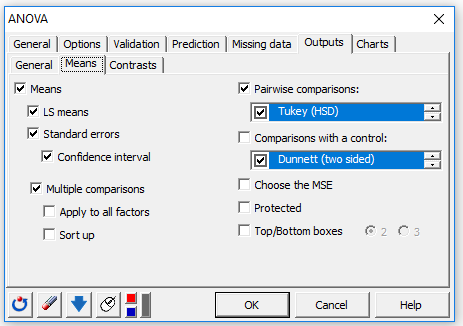
In the Multiple comparisons tab, activate the pairwise comparisons option, and then choose Tukey HSD. Activating the standard errors and confidence intervals options in this tab will compute those features around the means and display them in the results. Not activating the “Apply to all factors” option will allow you to choose model factors and/or interactions on which you wish to perform multiple comparisons. Click on the OK button.
Once you’ve clicked on the button, three dialog boxes appear successively. In the first one, you should define what set of factors and interactions you want to include in the general ANOVA models. In the two following ones, you should define the set of factors and interactions on which you wish to perform multiple pairwise comparisons for each of the two dependent variables. Select the three elements of the list (two factors and one interaction) in all of the three dialog boxes.
The results then appear in a new Excel spreadsheet.
Interpreting pairwise multiple comparisons following 2-way ANOVAs
For the taste variable, the three sum of squares ANOVA tables are exactly the same. This occurs when the experimental design is balanced. If the design is unbalanced, the Type III sum of squares table is the most reliable (take a look at this tutorial). Although the product effect on taste is not significant at 0.05 (p-value = 0.334), the statistical interaction Panelist x Product is very significant (p-value < 0.0001).

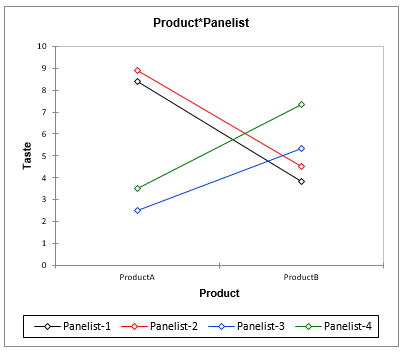
Interpreting this pattern can easily be done by using the bottom-right means chart: although on average both products are graded almost the same at the tasting scale (around 5.5), panelists seem to have very contrasted points of view. While panelists 1 and 2 strongly prefer product A over product B, panelists 3 and 4 prefer product B over product A. Furthermore, all of the panelists seem to agree on an average taste grade of product B.
Let’s focus now on the pairwise multiple comparisons section. Every factor or interaction has its own subsection. For the panelist factor, all the panelists are compared to one another regardless of the product. For the product factor, both products are compared regardless of the panelists. For the Panelist x Product interaction, all the combinations of levels between the two factors are compared to one another. Usually, it is interesting to pay attention to factors or interactions that are the most significant according to the ANOVA table. This is why we will take a closer look at the interaction term for the taste variable.
First, a table containing extensive information such as mean differences and corrected p-values for each pair is displayed.

Significance information arising from this table is summarized in a smaller table below, where all the combinations between the levels of the two factors are associated to letters. We will focus on this second table for interpretation.
Two level combinations sharing the same letter are not significantly different. Two combinations with no letter in common are significantly different.

Globally, the conclusions we drew from the means chart are statistically supported by the pairwise multiple comparisons tables.
In combinations that include product A (first two lines and last two lines in the table), Panelists 1 and 2 share the same letter (A) and have no letter in common with panelists 3 and 4, who also share the same letter (C). This means that the two groups of panelists disagree on product A. In combinations that include product B (4 central lines in the table), all combinations share the letter B. This means that all of the panelists agree on the taste of product B.
In a marketing perspective, it would be interesting to target consumers who have profiles similar to panelists 1 and 2 when advertising for product A. On the other hand, product B may deserve some taste improvement before considering to put it on the market.
For the sweetness dependent variable, the ANOVA tables show a very significant effect of product (p-value < 0.0001) and insignificant effects of Panelist (p-value = 0.704) and interaction (p-value = 0.427).

The bottom-right means chart shows that all of the panelists agree on the fact that product B is sweeter than product A.

It would be trivial to examine the multiple comparisons section here, because the only significant element of the model (i.e. the product factor) contains two levels, which will be necessarily different as suggested by the ANOVA tables.
Interpreting LS means charts
We have tested the interactive effects of panelist and product on both the taste and sweetness dependent variables. XLSTAT provides the LS means tool, which is useful to compare the effects of the same set of factors and interactions on different dependent variables.
An LS means summary table, as well as an LS means chart is associated to every factor and interaction.
For the panelist factor, the LS means summary table displays estimations of the mean grade of every panelist for each of the two dependent variables. Notice that within each dependent variable, pairwise multiple comparison significance letters are introduced as comments inside the cells containing estimations of the means. To display the letter(s) associated to a specific mean, just move the mouse cursor to the red triangle at the top-right corner of the corresponding cell.

The chart shows that, regardless of the products, panelists mostly disagree on the taste but agree on sweetness, which is supported by p-values associated with the panelist effects in both ANOVA models.

The Product LS means chart shows that regardless of the panelist, products are graded the same on average on the taste scale, while they are judged different at the sweetness scale.

Was this article useful?
- Yes
- No