Bootstrap statistics tutorial in Excel
XLSTAT has a resampling toolbox which can be used to obtain bootstrap resamples, standard deviation and confidence intervals in Excel. It allows to construct graphics based on the bootstrap distribution.
Dataset to generate Bootstrap statistics using Resampling
The data correspond to a sample of 150 irises for which 4 variables were measured. The flowers belong to 3 different species. Fisher used this dataset, now famous, when he developed his discriminant analysis theory. In this particular example, we decided to analyze the variable Sepal length of the flowers.
Goal of this tutorial
Using XLSTAT resampling toolbox, we want to obtain bootstrap means, bootstrap standard deviations and boostrap confidence intervals for some statistical measures. These bootstrap statistics are obtained without any distributional assumption. We will study the mean and standard deviations of the Sepal length variable.
Setting up a resampling
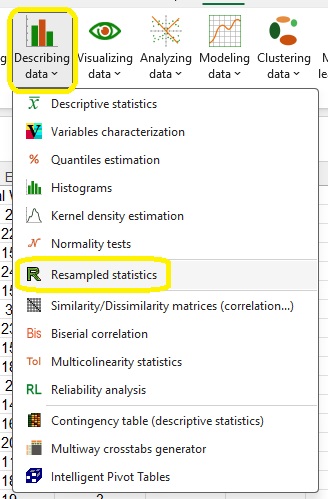
Once XLSTAT is open, select the XLSTAT / Describing data / Resampled Statistics command, or click on the corresponding button of the Describing data toolbar (see below).
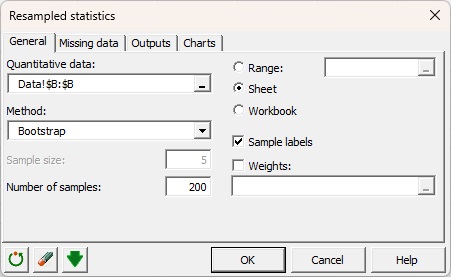
Once you have clicked on the button, the Resampled Statistics dialog box appears. The data corresponding to the variable "Sepal length" were selected on the Excel sheet.
Note that for a resampling, the data must be numerical data.
As the name of the variable was included in the selection, the Labels included option was also selected.
The Sheet option was selected because we wanted the results displayed on a new sheet of the workbook. The chosen resampling method is the bootstrap method with 200 resamples.
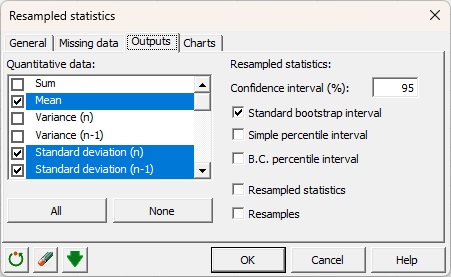
In the Outputs tab, select the statistics to be studied. We select the mean and both standard deviations.
The 95 % standard bootstrap interval is selected. You can display all 200 samples and resampled statistics using Resamples and Resampled statistics options.
In the Charts tab, histograms have been selected.
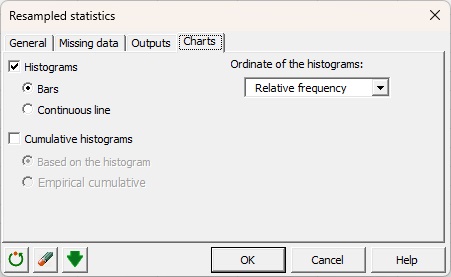
Click on OK to launch the analysis.
Interpreting the results of the resampled statistics
The results are displayed on the new sheet named "Resampling".
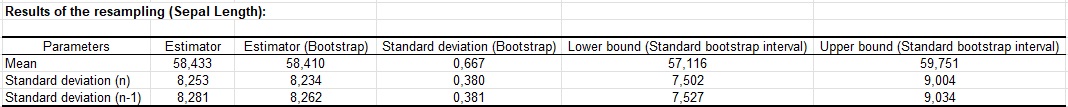
The following table gathers the obtained bootstrap statistics for the sample mean and standard deviations. We can see that bootstrap estimates are very close to the original estimates even with only 200 resamples. For the mean, the 95 % standard bootstrap confidence interval is very narrow. For the standard deviations, we can see that the sample-based and the population-based standard deviations are very close and that bootstrap estimates are very similar to original estimates. Confidence intervals are also very narrow even with 200 resamples.
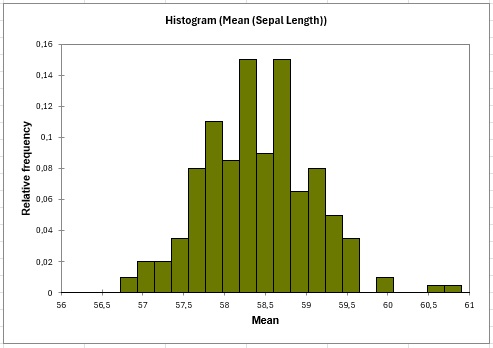
Histograms can be used to visualise the bootstrap distribution of the mean and standard deviations. For the mean, we see that 56 of the 200 values are in the range [58.2, 58.64], which also includes the mean over the original sample. The table of intervals is also given in order to better understand the distribution. The resampling tool automatically decides the number of intervals. If you wish to adapt it to your analysis, simply use the "Histograms" function of XLSTAT on the resampled statistics obtained when the “Resampled statistics” is selected on the “Outputs” tab.
This tool allows you to calculate different types of confidence intervals on a large number of descriptive statistics. The addition of weight and the treatment of several variables simultaneously are also possible.
Was this article useful?
- Yes
- No