Customer Lifetime Value in Excel tutorial
This tutorial shows how to perform the Customer Lifetime value (CLV) method in Excel using the XLSTAT statistical software.
Dataset and goal of this tutorial on Customer Lifetime Value (CLV)
The dataset represents a sample of monthly subscription data from a phone service provider. The period covered is from 2010 to 2014. Three groups of users from a value-based segmentation are represented: Young, Classic and Premium.
The goal of this tutorial is to calculate the CLV (customer lifetime value) of customers and also to estimate some KPI's such as the customers' retention rate or the time before churn.
Set up the Customer Lifetime Value (CLV) dialog box
Once XLSTAT is launched, select the Advanced Functions / Marketing Tools / CLV feature.
 The Customer Lifetime Value dialog box appears:
 In the General tab, select the column corresponding to the subscription price in the ARPA (Average Revenue Per Account) field. Then select in order the 2 columns related to the acquisition date and churn date in the field Time(acquisition/churn). Our data set contains segments variable, so check the case Segments and select the corresponding data to allow XLSTAT to produce results by segments. Finally, select the Variable labels to consider the variables names provided in the first row of the data set.
As the subscriptions are monthly, select monthly in the subscription period field.
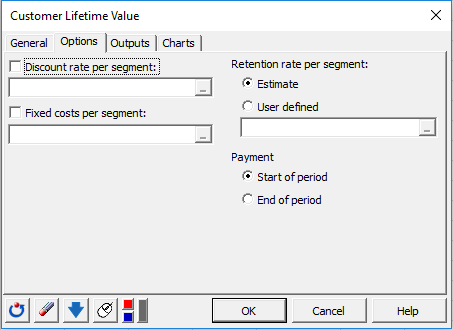
In the Options tab, we can take certain parameters such as the discount rate or fixed operating costs to be included in the CLV calculation. You can either choose to define the customers' retention rate if it is known or estimate it from the data by clicking on Estimate.
The customers being charged at the beginning of the month, we choose in the Payment section, the option Start of period.
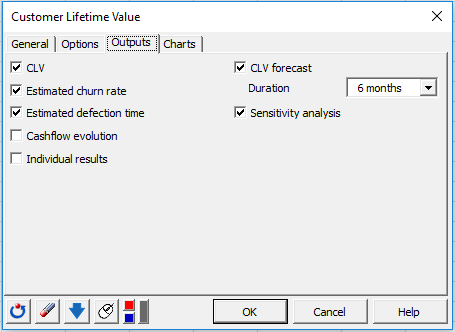
 In the Outputs tab, choose the results to display. Select CLV forecast to make simulations on the average CLV value of customers remaining in the database after the last recorded churn date over the user-defined period. In this tutorial, we choose a period of 6 months.
 The computations begin once you have clicked on OK. The results will then be displayed.
Interpret the results of Customer Lifetime Value (CLV)
The first result displayed is the average CLV per segment. The lowest average is for the Young segment.
 Then, the estimated churn and retention rates are displayed for each segment.
 As we can see premium customers are the least loyal and those in the Young segment the most loyal, with a monthly retention rate of 97.15%. We can, therefore, assume at this point, that those who spend the most money are not the most loyal.
Further on we have the estimations of the time before customers defection and the related chart.

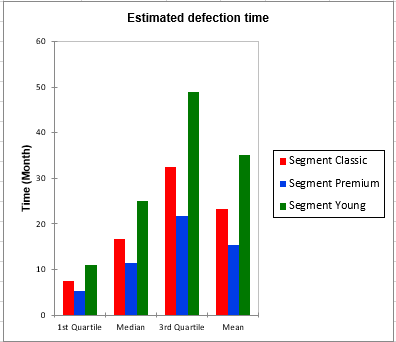 These results help us to see that half of the premium segment customers cancel their subscriptions before the end of the first year of subscription. It would be interesting to make a marketing campaign to increase customers loyalty in this segment.
Then the sensitivity analysis measures the impact of an increase in retention rate on CLV. The considered variations are increments of 5% from the estimated retention rate.
 We observe that a 5% increase in the retention rate of the Premium segment would increase the average CLV of this segment from €804.55 to €3537.73. This confirms the previous result which suggested to set up an action to increase the customer retention rate for this segment.
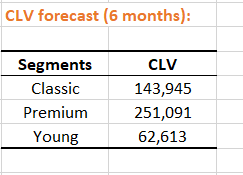
The last table concern the CLV forecast. It contains a simulation on the average CLV value of customers remaining in the database over the 6-month period following the last recorded churn date.
Was this article useful?
- Yes
- No