Cross-tab or contingency table in Excel
This tutorial shows how to create a cross-tab, also called contingency table from two qualitative variables in Excel using the XLSTAT software.
Dataset to create a cross-tab or contingency table
The dataset contains information on 20 clients: their age, city of residence and gender. We will create a contingency table based on the Age and City variables.
Creating a cross-tab or contingency table
After opening XLSTAT, select the XLSTAT / Preparing data / Create a contingency table command.

Once you've clicked on the relevant button, the dialog box appears.
In the General tab, select the category variable you wish to use in rows. Select the Age variable by selecting the entire column. Then select the variable to be used in columns. Here we choose the City variable. The columns B and C contain variable labels so the option Variable labels should be ticked.
You may activate the By group analysis field if you want to use a layer variable, such as the gender, and generate a three-way cross-tab.

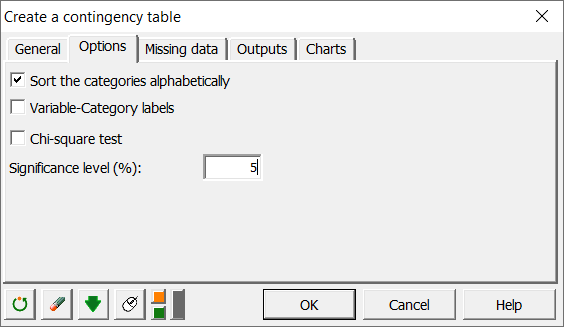
In the Options tab, you can decide how the categories of the variable should be treated. Also you can choose to run a Chi-square test. In this case, however, we will only select the Sort the categories alphabetically option.
In the Outputs tab, select the Contingency table as well as the observed and theoritical frequencies.

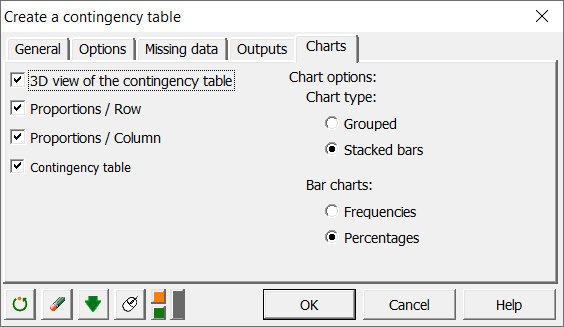
Select the following options in the tab Charts.
The computations begin once you have clicked on the OK button, and the results are displayed on a new sheet.
Results of the creation of a cross-tab or contingency table
The first result is the contingency table. Notice that clients are absent in certain crossed categories. For example there is no detected client in Paris of age class 25-34.

The next output is the 3-D plot followed by a stacked bar chart, which is a good visualization of the data distribution.


Next are the two tables containing the frequencies Age/City. You can compare the actual distribution of the clients and the theoritical distribution if the distribution was random.

Statistical tests on cross-tabs or contingency tables
It is possible to test if the two qualitative variables that shape the contingency table are independent.
Advantages of using XLSTAT cross-tabs instead of Excel pivot tables
Among the many advantages of using the XLSTAT contingency table feature compared to Excel pivot tables: - XLSTAT is able to automatically output test results on the contingency tables.
-
You can enter as many qualitative variables as you want in both the row and column variable fields in XLSTAT. XLSTAT will produce one result for each possible pair of row/column variables.
The following video tackles crosstabs with an illustration using XLSTAT:

Was this article useful?
- Yes
- No