Variables characterization tutorial in Excel
This tutorial explains how to study links between variables of the same type or of a different type using the Variable characterization tool of the XLSTAT software.
Dataset for running a variables characterization
The data have been collected for a medical supervision project carried out in Angers (France). Precisely, doctors of the local teaching hospital have studied the snoring condition among 100 patients between 2000 and 2002.
Goal of this tutorial on variables characterization
Using the variables characterization XLSTAT feature, the goal is to study the possible links between the various variables of the data set: 4 quantitative variables Age, Weight, Size, Alcohol and 2 qualitative variables Gender and Snoring.
The Variables Characterization function allows studying links between variables of the same type or of a different type. This tutorial has 5 parts associated with 5 five sheers in the demo file. It presents the different results according to the study of the relationships between the variables and according to the nature of these variables (quantitative or qualitative).
Setting up variables characterization with XLSTAT
After opening XLSTAT, select Describing data - Variables characterization (see below).
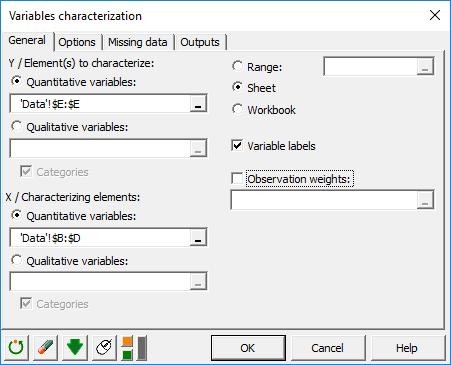
 Once you’ve clicked the button, the Variables characterization dialog box appears.
Then you can select the data on the Excel sheet.
Once you’ve clicked the button, the Variables characterization dialog box appears.
Then you can select the data on the Excel sheet.
1. Link between quantitative variables
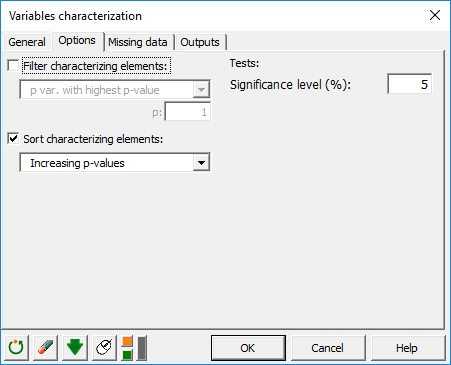
First, we will study the relationship between the quantitative variable Alcohol (element to characterize) and the three other quantitative variables Age, Size and Weight (characterizing elements). We choose to display the results in ascending order of p-values (this will also be the case for other examples).
 The computations begin once you have clicked on OK. The results will then be displayed in a new sheet, named Variables characterization.
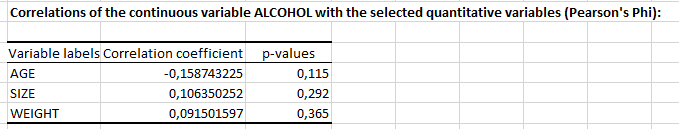 None of the p-values is lower than the threshold of 5%, so we cannot reject the hypothesis of zero correlation. We can, therefore, conclude that the variable Alcohol is not related to the variables Weight, Size and Age.
2. Link between qualitative variables
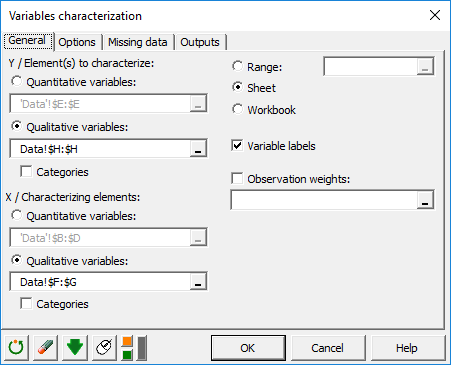
In the second part, we study the relationship between the qualitative variable Snoring (element to characterize) and the other two qualitative variables Gender and Tobacco (characterising elements).
 The computations begin once you have clicked on OK. The results will then be displayed.
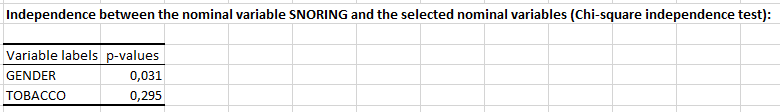 The p-value associated with the variable Gender is lower than the threshold of significance of 5% so we can conclude that there is a link between the variable Snoring and the variable Gender. However, variables Snoring and Tobacco seem to be independent (p-value>5%).
3. Link between quantitative and qualitative variables
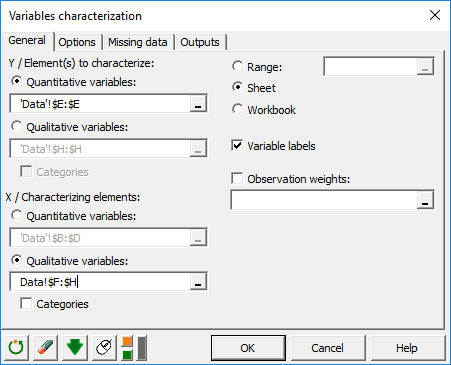
In the third part, we study the relationship between the quantitative variable Alcohol (element to characterize) and the three other qualitative variables Gender, Tobacco and Snore (characterizing elements).
 The computations begin once you have clicked on OK. The results will then be displayed.
The results below are contained in the “Variables characterization2” tab.
The computations begin once you have clicked on OK. The results will then be displayed.
The results below are contained in the “Variables characterization2” tab.
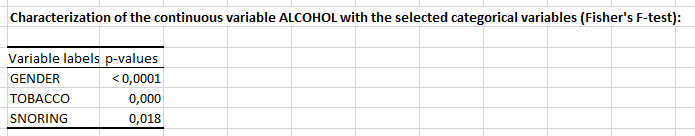 The three p-values are lower than the threshold of significance of 5% so we can conclude that there is a link between the quantitative variable Alcohol and the three qualitative variables.
4. Link between quantitative variables and categories
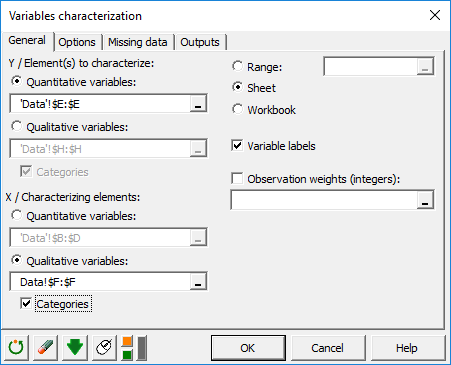
In the fourth part, we study the relationship between the quantitative variable Alcohol (element to characterize) and the categories of the qualitative variable Gender (characterizing elements).
 The computations begin once you have clicked on OK. The results will then be displayed.
The results below are contained in the “Variables characterization3” tab.
The computations begin once you have clicked on OK. The results will then be displayed.
The results below are contained in the “Variables characterization3” tab.
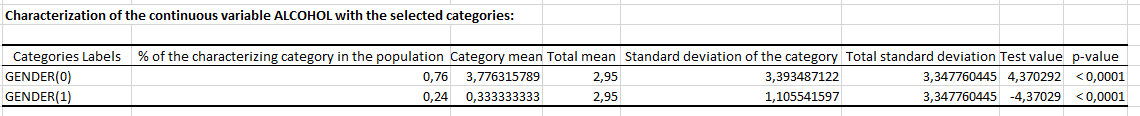 Significative p-values and test values show that men (SEXE-0) have a higher alcohol consumption than the average one. On the other hand, women (SEXE-1) have a lower alcohol consumption than the average one.
5. Link between categories of different qualitative variables
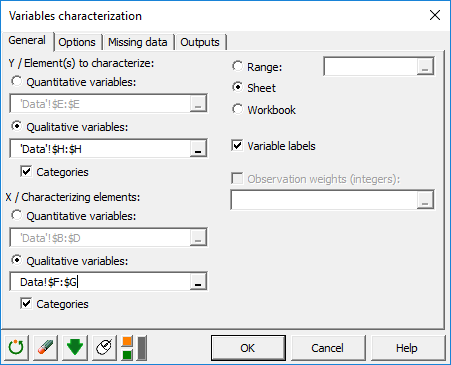
In this last part, we study the relationship between the categories of the qualitative variable Snore (elements to characterize) and the categories of the qualitative variables Gender and Tobacco (characterizing elements).
 The computations begin once you have clicked on OK. The results will then be displayed.
The results below are contained in the “Variables characterization4” tab.
The computations begin once you have clicked on OK. The results will then be displayed.
The results below are contained in the “Variables characterization4” tab.
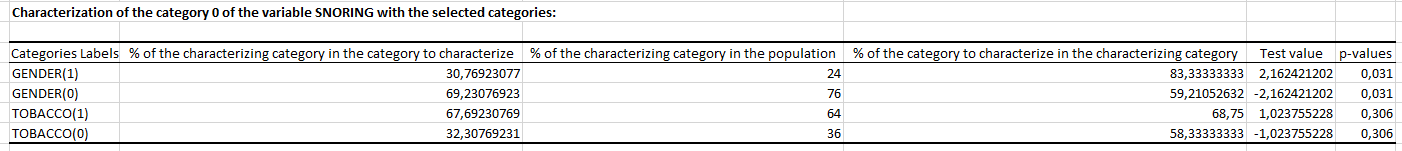 We see that among snoring people (Snoring-1), men (SEX-0) are over-represented compared to women where this difference is considered to be significative. It is also noted that being a smoker does not affect snoring.
Conclusion
The above analyses showed how we can study links between different variables of different types. Various conclusions can be drawn from the results. For example, we saw that there was a strong link between alcohol consumption and gender, a strong link between snoring and gender but no significant link between snoring and smoking.
Was this article useful?
- Yes
- No