What is Supervised Machine Learning?
This guide is an introduction to the Supervised Machine Learning process, which is used to optimize algorithms for predictive purposes.
What is Machine Learning?
Machine Learning gathers computer algorithms that learn tasks from patterns found in data, like recommending articles online based on past purchase behavior data. Machine Learning is part of Artificial Intelligence, in a sense that it mimics the learning cognitive skill of humans.
What is the difference between Supervised & Unsupervised Machine Learning?
Unsupervised and Supervised Machine Learning are the two mostly used branches of Machine Learning.
Unsupervised Machine Learning
Unsupervised Machine Learning includes methods allowing to map consumers, customers, patients, environmental samples, or any set of objects, or to cluster them into groups of similar objects. There is no outcome to predict. Common Unsupervised Machine Learning tools include k-means clustering, Agglomerative Hierarchical Clustering (AHC), Principal Component Analysis (PCA) and more. Check out this guide for choosing an appropriate method.
Supervised Machine Learning
Supervised Machine Learning is a set of algorithms that allow the computer to learn how to predict an outcome from a set of predictors. There should be a dependent, or Y variable in the data set. This variable is the one we want the computer to learn how to predict. The other variables are the Predictors, also called X variables and are used by the computer to build models allowing to predict Y.
When Y is a qualitative (i.e categorical) variable, we are working on a classification task. When Y is quantitative, it is a regression task.
Supervised Machine Learning: classification task examples
E-Commerce
The computer learns to recommend articles to customers based on past data including purchase history and profiles of other clients.
Fraud detection in insurance
The computer learns to detect fraud based on past behavior data linked to confirmed cases of fraud/non-fraud.
Medicine
The computer learns to predict the predisposition to a disease based on genetic data associated to confirmed cases of disease/non-disease.
Web Marketing
The computer learns to predict the risk of customer loss based on past behavior data. This is also known as churn analysis.
Industry
The computer learns how to predict a future failure on a production chain based on past failure and success data associated to different signals. This allows engineers and technicians to intervene early enough to prevent the failure. This is called predictive maintenance, a technique which has become a major component of Industry 4.0.
Supervised Machine Learning: regression task example
Finance
The computer learns how to predict the price of real estate properties based on characteristics and selling price of other recently sold properties in the area.
Which Supervised Machine Learning algorithm to choose?
As shown in the algorithms grid in this article, there are many possible algorithms we can choose among in each situation. Which one should one choose?
In addition, each algorithm can be tuned in different ways through algorithm-specific parameters we call hyperparameters. Which tuning configuration should be kept?
The answer is there is no perfect single Algorithm and tuning combination that outperforms all the other combinations in all cases. Today, data scientists test the performance of different tunings within different algorithms on the dataset they are working on. Ultimately, they keep the tuned algorithm which shows the best performance for predictions.
How to measure the performance of a Supervised Machine Learning algorithm?
Cross Validation
The performance of a supervised Machine Learning algorithm is measured through cross validation. The main idea is to build a predictive model and test it on data it has never seen. This mimics the real-world context where the model will be deployed and utilized as a predictive tool.
The data is split into two sets of observations: the training, also referred to as the learning set, which is usually the largest, and the test set. The computer uses the training set to build a predictive model. Then the predictive performance of the model is challenged with the test set. The model predicts Y outcomes based on the X data from the test set. If the predictions and the real observed Y data match well, then the algorithm has a good performance. There are indices which measure the algorithms’ performance.
The predictive performance is also measured on the training set. This is useful to assess variance (see further below).
Performance indices for classification tasks
In classification tasks, most of performance indices are computed out of a confusion matrix, which displays the number of predictive successes and failures for each Y category. For a binary Y (survival/death, fraud/non-fraud…), the confusion matrix has four cells. In the following matrix, we code the two binary outcomes as 1 and 0.
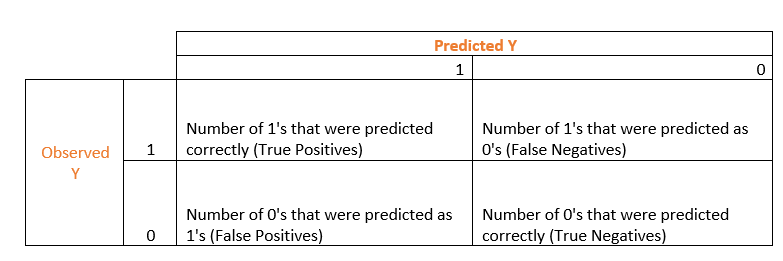 The most intuitive index to extract from this matrix is the accuracy, which is the prediction success rate:
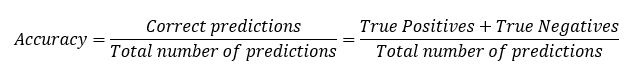
This index is not reliable in cases of strong imbalance in the Y categories in the data. This happens when the algorithm is learning to detect fraud, where the input data often contains many more historical cases of non-fraud than of fraud. Other indices can be used instead of accuracy in case of class imbalance. For instance, the Area Under the Curve (AUC) index based on a Receiver Operating Characteristic (ROC).
Other indices such as recall or precision or specificity may be more appropriate in specific situations.
Performance indices for regression tasks
In regression tasks, Root Mean Square Error (RMSE) is commonly used. It measures the square root of the mean squared differences between observed and predicted Y’s. The lower the better.
Model performance: assessing Bias and Variance
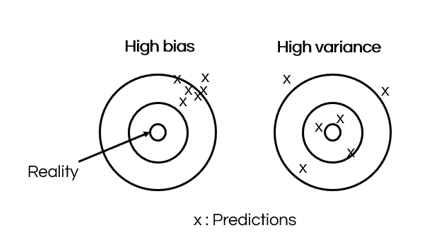
A performant model has low Bias and low Variance.
Bias measures the difference between the correct Y outcomes and the predictions of a machine learning model. A model with high bias may be too simple or is not trained well enough on the training data. Bias is reflected by a bad predictive performance on both the training and test sets.
Variance measures how noisy the predictions are. A model with high variance is too overfitted on the training data and does not generalize well on new data. Variance is reflected by a performance on the training set which is much better than the performance on the test set.
What are the main steps of a Supervised Machine Learning process?
Ask the question and set performance goals
It is important to ask the question very accurately. Then it is useful to set performance goals in terms of performance index values to try to reach for instance. For example, reaching a precision of 0.95 in a classification task.
A set of candidate algorithms is then selected. This guide compares several algorithms available in XLSTAT.
Pre-process data:
Data pre-processing is a critical step in the Supervised Machine Learning process. This includes data cleaning, dealing with missing data, creating more informative predictors through feature engineering (example), dealing with class imbalance in classification problems, dealing with multicolinearity among the predictors…
Select the most performant algorithm and tuning
Use cross-validation to compare the performance of different algorithms with hyperparameters tuned in different ways. Keep the most performant case in terms of bias and variance.
Use the model to predict
The optimal model can then be used in the real world to predict Y outcomes: articles to recommend, risk of fraud, chance of disease…
Reassess the performance of the model with recent cases
It is recommended to regularly assess the predictive quality of the model by challenging it with recent cases linked to known Y values. If this shows a decrease of the model’s quality, it is advisable to consider a search for a more optimal model using cross validation.
Was this article useful?
- Yes
- No