Discretizing a continuous variable in Excel
This tutorial will help you discretize a continuous variable based on different methods, in Excel using XLSTAT.
Dataset to discretize a continuous variable and goal of this tutorial
The data used in this tutorial corresponds to a list of patients with information relating to their heights, masses and BMI.
In this particular example, we decided to divide the patients into different groups according to their BMI.
Setting up the discretization of a continuous variable
Once XLSTAT is activated, select the XLSTAT / Preparing data / Discretization, or click on the corresponding button of the "Preparing Data" toolbar (see below).

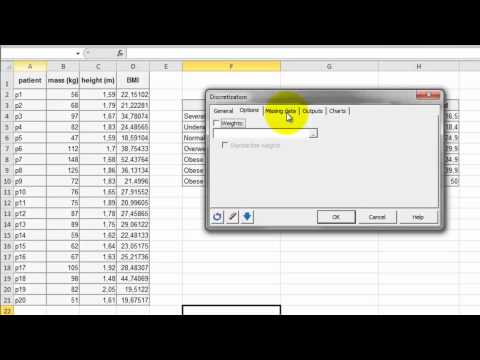
Once you have clicked on the relevant button, the dialog box appears.
You should select the data on the Excel sheet corresponding to the BMI (column D). Tick the option Column labels as the selection contains the variable name "BMI".
Tick the option Row labels and select the name of the patients (column A).
There are several options with which to group the samples:
-
Constant range: Choose this method to create classes that have the same range. Then enter the value of the range. You can optionally specify the "minimum" that corresponds to the lower bound of the first interval if needed.
-
Intervals: Use this method to create a given number of intervals with the same range.
-
Equal frequencies: Choose this method so that all the classes contains as many of the same number of observations as possible.
-
Automatic (Fisher): Use this method to create the classes using Fisher’s algorithm.
-
Automatic (k-means): Choose this method to create classes (or intervals) using the k-means algorithm.
-
Intervals (user defined): Choose this option to select a column containing the lower bound of the first interval, and the upper bound of all the intervals in increasing order.
-
80-20: Use this method to create two classes, the first containing the first 80% of the series, the second containing the remaining 20% with the data sorted in increasing order.
-
20-80: Use this method to create two classes, the first containing the first 20 % of the series, the second containing the remaining 80% with the data sorted in increasing order.
-
80-15-5 (ABC): Use this method to create two classes, the first containing the 80 first % of the series, the second containing the next 15%, and the third containing the remaining 5% with the data sorted in increasing order. This method is sometimes referred to as "ABC classification".
-
5-15-80: Use this method to create two classes, the first containing the first 5 % of the series, the second containing the next 15%, and the third containing the remaining 80% with the data sorted in increasing order.
We will select the Intervals (user defined) option and use the bounds defined for XLSTAT in the Microsoft Excel sheet.

Go to the tab Outputs to select which results to compute. Select the Centroids, Results by class and Results by object.

Go to the tab Charts and select histograms as bars with frequency.

When ready click on the OK button.
Results of the discretization of a continuous variable
The results are displayed on the new sheet named "Discretization".
The first result is the histogram. Notice that the size of the bar correspond to the size of the class.
Next is the table of the descriptive statistics for the intervals. Most of the patients (10) are in the third class which correspond to a normal weight.

Then you have the class centroids that may not be the same as the centre of each class.
Finally you have the dispersion of the patients into their BMI class.

The following video show you how to proceed with this tutorial.
Was this article useful?
- Yes
- No