Competitive inhibition using nonlinear regression in Excel
This tutorial explains how to set up and interpret the parameters of a competitive inhibition using nonlinear regression.
Nonlinear regression is used to model complex phenomena which cannot be handled by linear models, and which is the case for the different types of inhibition (competitive, non-competitive, uncompetitive and mixed).
In this tutorial, we will detail the necessary steps to evaluate and interpret the parameters of a competitive inhibition. A data file is provided above to test the method. Data are fictitious and were created for this tutorial.
Goal of this tutorial
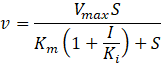 Let's start with a quick explanation of the problem. Enzymes are proteins that combine with reagents in a chemical reaction to reduce the amount of energy required for the reaction. Sometimes, as some drugs do, it is necessary to prevent the substrate from binding to the enzyme and thus prevent the enzyme from converting it to product. This is the role of competitive inhibitors. The equation to identify this role is as follows:
Where v is the speed of the enzyme, Vmax is its maximum speed, S is the substrate concentration, Km is the Michaelis constant, Ki the constant of the inhibitor, and I the inhibitor concentration which depends on each curve.
In this tutorial we will seek to determine the best estimate of the parameters Vmax, Km and Ki for all the curves. These parameters are common to all curves, which is why we directly use a global fitting. Our goal is to study the relationship between the substrate concentration of an enzyme and its maximum speed.
The results are divided into different sheets:
- Data: This sheet contains the selected variables.
- Nonlinear Regression: This sheet contains the results of the nonlinear regression.
Set up a nonlinear regression to estimate the parameters of competitive inhibition
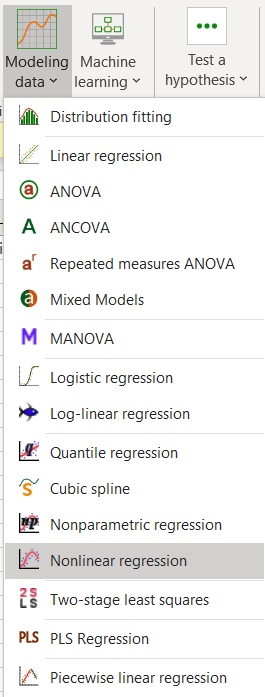
After opening XLSTAT, select XLSTAT / Modeling / Nonlinear regression.
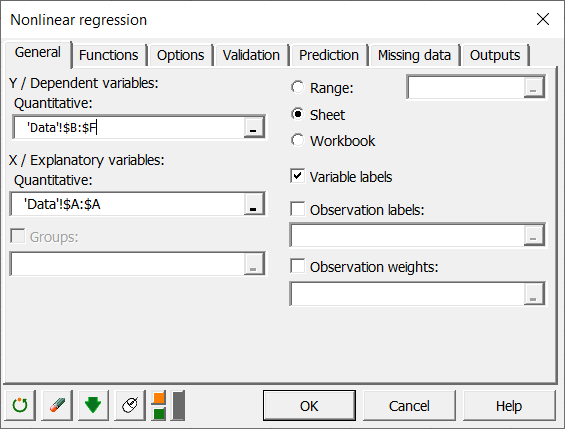
 Once the button is clicked, the dialog box pops up. You can then enter the dependent variables which correspond to the Y columns which are all the curves, and the explanatory variable which in this case is the substrate concentration.
 In the Functions tab, choose the formulas for competitive inhibition (enzymatic kinetics / competitive inhibition), and enter the different concentrations of the inhibitor, one concentration for each of the curves.
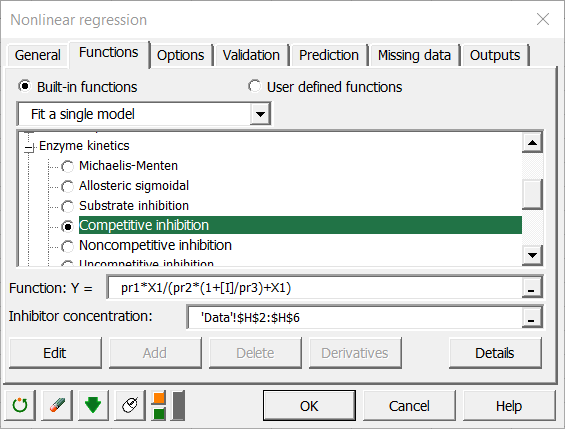 You can, if you wish, add starting values, limits and labels for the parameters. Then click on the OK button, the calculations are carried out and the results displayed.
Interpret the results of a competitive inhibition model
Following the descriptive statistics of variables, and the goodness of fit coefficients, a third table provides details on the parameters of the model. Since the parameters are the same for each of the curves (only the inhibitor concentration varies), we only display the first ones of the table.
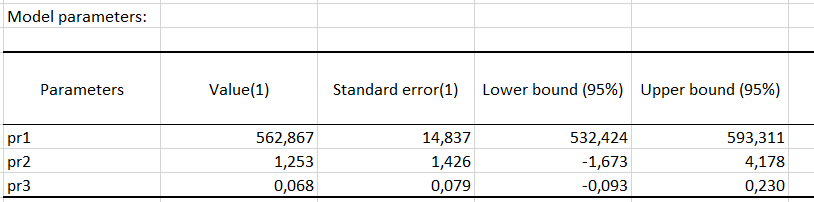 These values are the ones that best estimate the parameters of the model. We can then see, with the graph of the curves speed as a function of the substrate, that the estimated parameters allow to obtain a very good fit of the data.
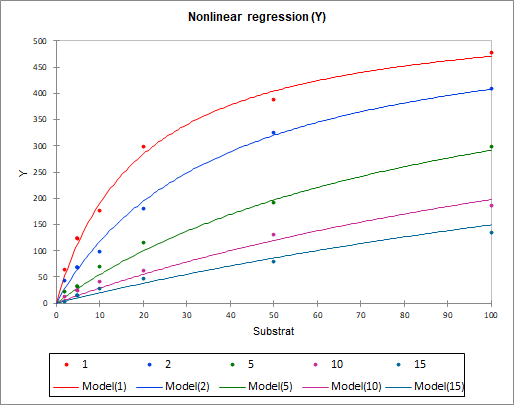
These four curves, which each represent one of the dependent columns, are lower and lower as the inhibitor concentration increases.
Finally, we can see that in the case of competitive inhibition, the nonlinear regression allows to measure the speed curves as a function of the substrate concentration in the presence of several inhibitor concentrations. XLSTAT also proposes to do this for non-competitive inhibition, uncompetitive inhibition and mixed inhibition.
Was this article useful?
- Yes
- No