LASSO regression in Excel
This tutorial explains how to set up and interpret LASSO regression in Excel using the XLSTAT statistical software.
Dataset for LASSO regression
The original data are from Osborne and al. (1984). The dataset contains, for 30 cookies, the discretizations of near-infrared spectra. Each spectrum is observed at wavelengths ranging from 1100 to 2460 nanometers and spaced by 40 nanometers, which leads to 35 explanatory variables in the dataset. The data table also contains the water composition of each cookie.
The goal is to predict the water composition of the different cookies.
Goal of this tutorial
The goal of this tutorial is to set up and interpret a LASSO regression on the Cookies dataset.
Setting up a LASSO regression in XLSTAT
-
Once XLSTAT is open, click on Modeling / LASSO regression.
-
The LASSO regression dialog box appears.
-
Select the data on the Excel sheet. Here, the Dependent variable (or variable to model) is the water composition of the cookies.
-
The Quantitative explanatory variables correspond to all columns numbered L1 to L35. Here we want to explain the variability of the water content in the cookies as a function of the spectrum.
-
Select the first 20 cookies of the dataset, the rest will be used for the prediction set.
-
As the name of each variable is displayed at the top of the table, check the Variable labels checkbox.
-
Check the Observation labels box and select the name of the different cookies.

-
In the Options tab, use Cross-validation to find the optimal lambda regularization parameter. Choose to form 5 folds for the cross-validation and to test 100 lambda values.
-
In the Prediction tab, select the data on which you want to get a prediction. Here we select the last 10 cookies in the dataset.
-
In the Charts tab, you can activate the option Evolution of the MSE (Cross-validation) which allows you to have access to the evolution of the MSE (Mean Squared Error) depending on the regularization parameter.
Interpreting a LASSO regression
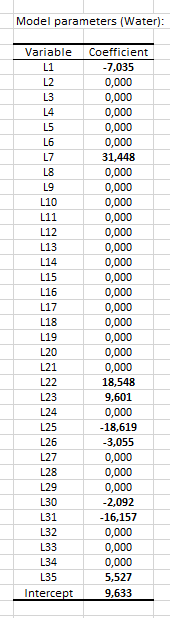
The table “Model parameters” gives details on the model. This table is helpful when predictions are needed or to analyze the importance of variables in the model. We see that only 9 of the 35 variables were kept in the modeling, the others have a zero coefficient.
The following chart shows the evolution of the MSE depending on the Lambda regularization parameter. The Lambda value selected by XLSTAT is the one that minimizes the MSE, here the value 0.01.

The last table gives, following the estimation of the model, the predictions of the water composition of the 10 cookies using in the prediction dataset.

Conclusion on LASSO regression
Finally, LASSO regression has modeled the water composition of the different cookies with only 9 of the 35 available variables: the other variables were judged not explanatory enough or as containing information too similar to one of the already selected variables.
Was this article useful?
- Yes
- No