Cochran C test to detect outlying variances tutorial
This tutorial will help you run a Cochran C test to detect outlying variances and interpret the results in Excel using XLSTAT.
Dataset for testing variances with a Cochran C test
Four samples have been obtained from two different distribution: 3 with a normal distribution with mean 0 and variance 2 and one with a normal distribution with mean 0 and variance 5 .We wish to test if there is a variance larger than the others
Goal of this tutorial
We would like to detect if a variance is larger than the others using the Cochran C test.
Setting up a Cochran C test to detect an outlying variance
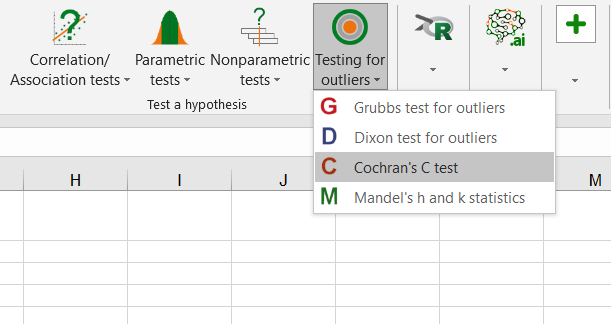
To start the Cochran C test go to the menu Testing outliers / Cochran's C test.
In the General tab, select the data. Four columns should be selected with the option one column per group. Since the number of observation per sample are equal, we use the balanced option.

As an alternative hypothesis choose the two-sided option. The default significance level is left as is: 5%.
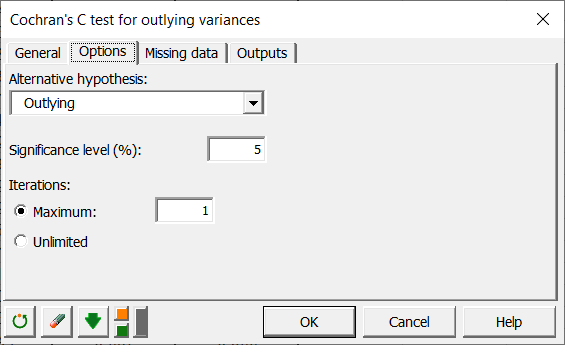
When ready click on OK.
Interpreting a Cochran C test
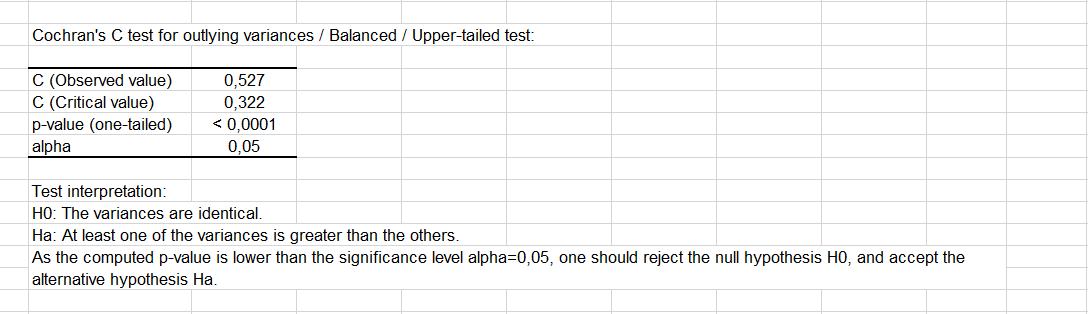
The result is that the p-value for this test is smaller than 0.0001. That means that the null hypothesis should be rejected.
In the following table, the detected variances and outliers are given.

Then, a graphic with all variances represented is displayed.

We have shown that there is an outlying variance in our dataset.
Was this article useful?
- Yes
- No