Page non parametric test in Excel tutorial
This tutorial shows how to set up and interpret a Page test on dependent samples in Excel using XLSTAT.
How does the Page test work?
The Page test is an alternative to the Friedman test in the case where one wants to use an alternative hypothesis by classifying the treatments instead of taking into consideration a difference between at least two treatments. This test enables us, when it makes sense, to get more information from the collected data.
Let t be the number of treatments. Then, the associated null and alternative hypotheses are :
- H0 : The k treatments are not significantly different.
- Ha : t1 ≤. t2 ≤ … . ≤ tk
or
- Ha : t1 ≥. t2 ≥ … . ≥ tk
where at least one inequality is strict for the alternative hypotheses.
Dataset to run a Page test in XLSTAT
A study has been led on 20 students by making them take a test three times a year in order to measure their progress. The grades go from 1 to 5. In the context of our analysis, the tests are the treatments.
We now wish to know if the grades of the students have evolved, or if we can suppose an evolution in a given direction (here we are hoping for an improvement). The used data here correpond to a complete scheme. However, XLSTAT can also run the test even if some data are missing.
Setting up a Page test
Once XLSTAT is open, go to the Nonparametrical tests menu in XLSTAT.
The dialog box appears. You can then select the data on the Excel sheet in the General tab.
 In the Options tab, choose to calculate the asymptotic p-value in order to proceed like most software.
With XLSTAT, you can also run Monte-Carlo simulations in order to estimate the p-value better.
The calculations start when you click on OK then the results are displayed.
Interpreting the results of a Page test
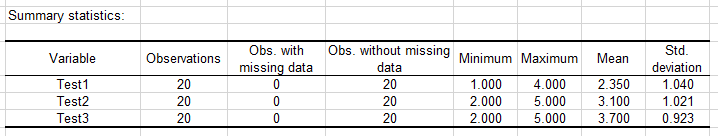
First, we have a descriptive statistics table containing the names of the variables, the number of observations, the amount of missing data, the minimum, maximum, mean and standard deviation.
A Page test is ran in order to see if the treaments are identical or different.

We can therefore reject the null hypothesis and we can suppose that the students have improved their results during the year.
 We see that the three tests are strictly ordered : T1<T2<T3. A final tab sums up the significant differences.
Was this article useful?
- Yes
- No