Conjoint analysis in Excel tutorial
This tutorial will help you design and interpret a full profile conjoint analysis in Excel using the XLSTAT statistical software.
What is Conjoint analysis
Conjoint analysis is a popular marketing method that allows to know the expectations of consumers about a product and to model their choices - both crucial steps of a marketing analysis. Conjoint analysis in XLSTAT can be used to simulate competitive markets using a single analysis; it is its biggest advantage.
XLSTAT-Conjoint analysis allows you to run through all the analytical steps of conjoint analysis which can be divided into five steps: 1. Choice of the relevant factors and their levels to describe the products. 2. Generation of a design of experiments based on full factorial, fractional factorial, or D-optimal. 3. Collection of the results in Microsoft Excel sheets. 4. Data analysis with specific regression methods - MONANOVA (monotone regression), multinomial logit, conditional logit, etc. 5. Simulation of new markets with various methods: first choice, logit, Bradley-Terry-Luce, randomized first choice.
These steps can be carried out for a full profile conjoint analysis or a choice based conjoint analysis (CBC).
In this tutorial, we will develop the steps for the implementation and interpretation of a full profile conjoint analysis with prohibited pairs.
Dataset to run a full profile conjoint analysis
In this example, we will study a classic case of conjoint analysis: how to introduce a new product in a competitive market. More specifically, an ice cream shop wants to introduce a new ice cream. The conjoint analysis will be used to answer the following questions: what are the characteristics that the ice cream should have in order to, first, please the greatest number of people, and, second, gain market shares in an already competitive market?
The results are divided into different sheets: 1. Factors: this sheet contains the characteristics of the selected factors. 2. CJT Design: this sheet contains the profiles generated and the rankings given by the 15 individuals. 3. CJT Analysis: this sheet contains the results of conjoint analysis (CJT). 4. Market generator: this sheet contains the complete market to simulate. 5. Market Simulation: this sheet contains the results of the market simulation.
Setting up a full profile conjoint design with XLSTAT
Choosing the factors
The first step is the choice of important characteristics that define an ice cream. This is done in collaboration with experts in the ice cream market. The selected factors are : 1. Flavor (Raspberry, Mango, Strawberry, Vanilla, Chocolate) 2. Packaging (Cone, Homemade waffle, Pint) 3. Is the ice cream Low fat (Low fat, Not low fat)? 4. Is the ice cream organic (Not organic, Organic)?
By permuting the different levels of these factors, one can get 60 different combinations corresponding to 60 products. Judges (respondents) will not be able to evaluate them all. Therefore, we will use experimental designs to reduce the number of products presented to the respondents. The obtained profiles will be ranked by 15 interviewed people.
Profile selection
XLSTAT-Conjoint analysis uses experimental designs to select a number of profiles and allow interviewed people to make their rankings.
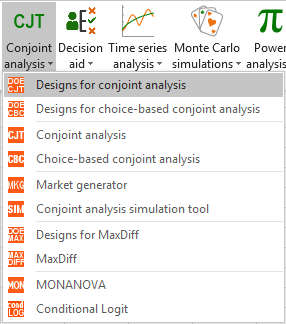
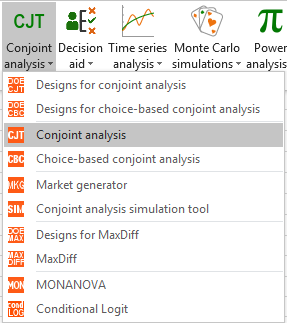
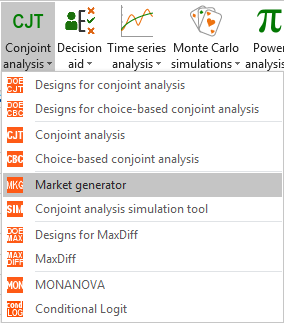
Launch XLSTAT and select the Designs for conjoint analysis function:
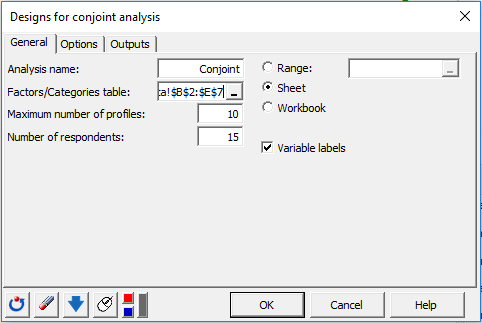
 A dialog box will then appear. You can now enter the name of your analysis, select the Factors/Categories table and the number of profiles to be generated (10).
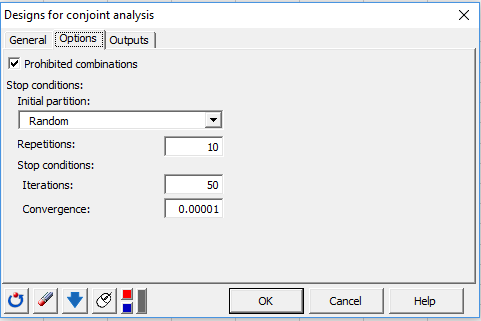
 In the Options tab, we check the option prohibited combinations in order to exclude some combinations of modalities from the survey.
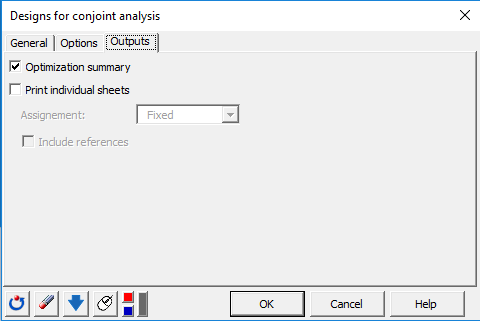
 In the Output tab, individual sheets are not activated since the use of these sheets is not necessary for the tutorial. In a comprehensive analysis though, they can be very useful in order to get the responses filled directly by respondents.
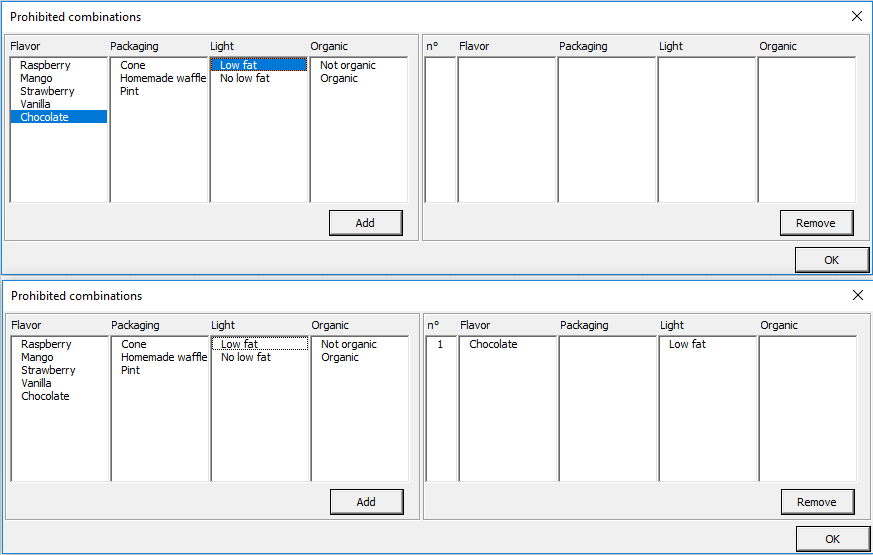
 Once you click on OK, a first dialog box appears asking for the selection of prohibited combinations. We choose here to prohibit the chocolate flavor with the type of lightened ice. For that we select chocolate and low fat in the left part of the interface, then click on Add, and finally on OK.
 The next widows appears which allows you n case we do not select prohibited combinations, another dialog box appears. This allows you to select a specific fractional factorial design or to optimize the design (D-optimal). Here, we used the optimize option.
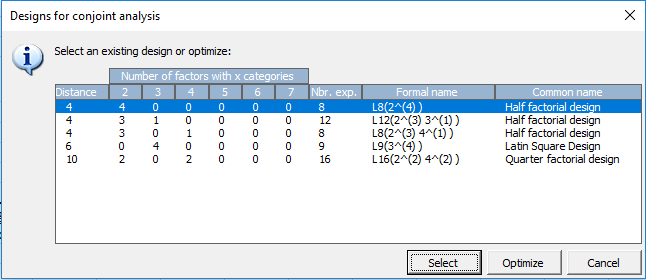 Here, with prohibited combinations, the optimize option is automatic.
Once you click the OK button, the calculations run and the results are displayed.
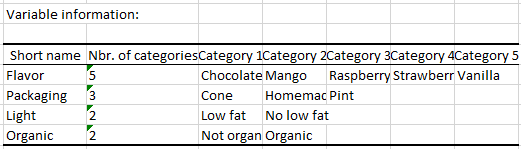
The first table summarizes the generated model.
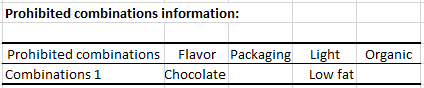
 The second table is a summary table of prohibited combinations.
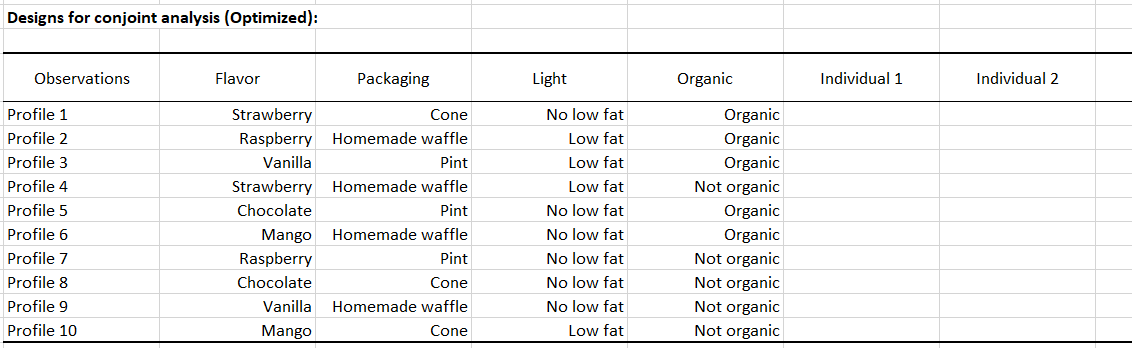
 The third table shows the conjoint design starting with the profiles on the left part. The right part of the table has to be filled with the rankings of each respondent.
 Setting up a full profile conjoint analysis with XLSTAT
First, we need to fill the conjoint design table generated in the previous step. This can be done can either directly in the CJT design sheet after interviewing individuals or using the individual sheets with automatic referencing of results.
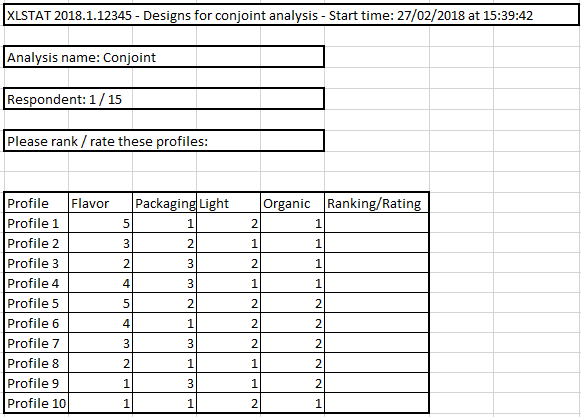 For the aim of this study, 15 individuals have been questioned about their ice cream preferences. The survey answers can be found in the CJT design sheet and the results of the analysis in the CJT Analysis sheet.
Once the conjoint design is filled with the responses, you are ready to run the analysis. One option is to click on the button Run the analysis which automatically launches the interface with loaded data.
Alternatively, you can click on CJT / Conjoint analysis.
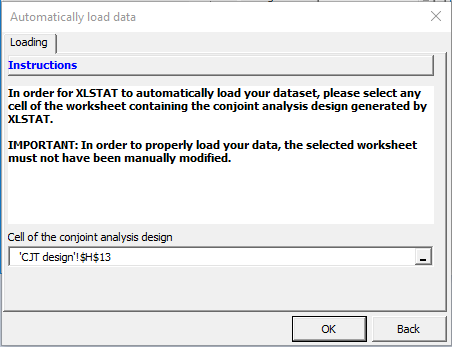
 To facilitate data selection and avoid to manually select the two required datasets (Responses and Profiles), you can click on the magic stick. This will automatically load the two datasets if the conjoint design has been generated with XLSTAT and if the results sheet has not been manually modified (addition of rows or columns…). A new window will pop up. Select any cell of the sheet containing the design for conjoint analysis. In this example, we selected the cell H13 of the CJT Design sheet. Then click OK.
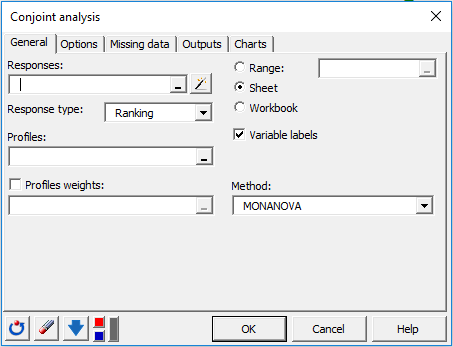
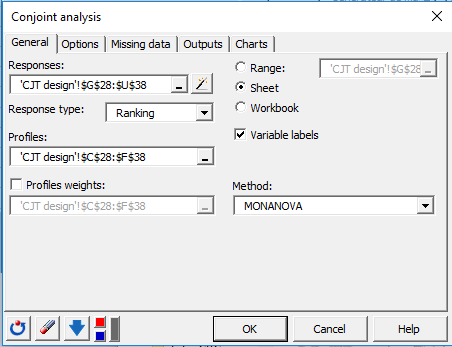
 You can also select your data manually. In the Responses field, select the 15 columns of the conjoint design corresponding to the individuals' rankings (right part of the table). In the Profiles field, select the columns associated with the different profiles (excluding the profile names). Choose the ranking option as response type.
 Once you click on the OK button, the computations are performed and the results are displayed.
Interpreting the results of a full-profile conjoint analysis
The most important results are the partial utilities as well as the individual importances. These are calculated at an individual level. They can be found in the below tables.
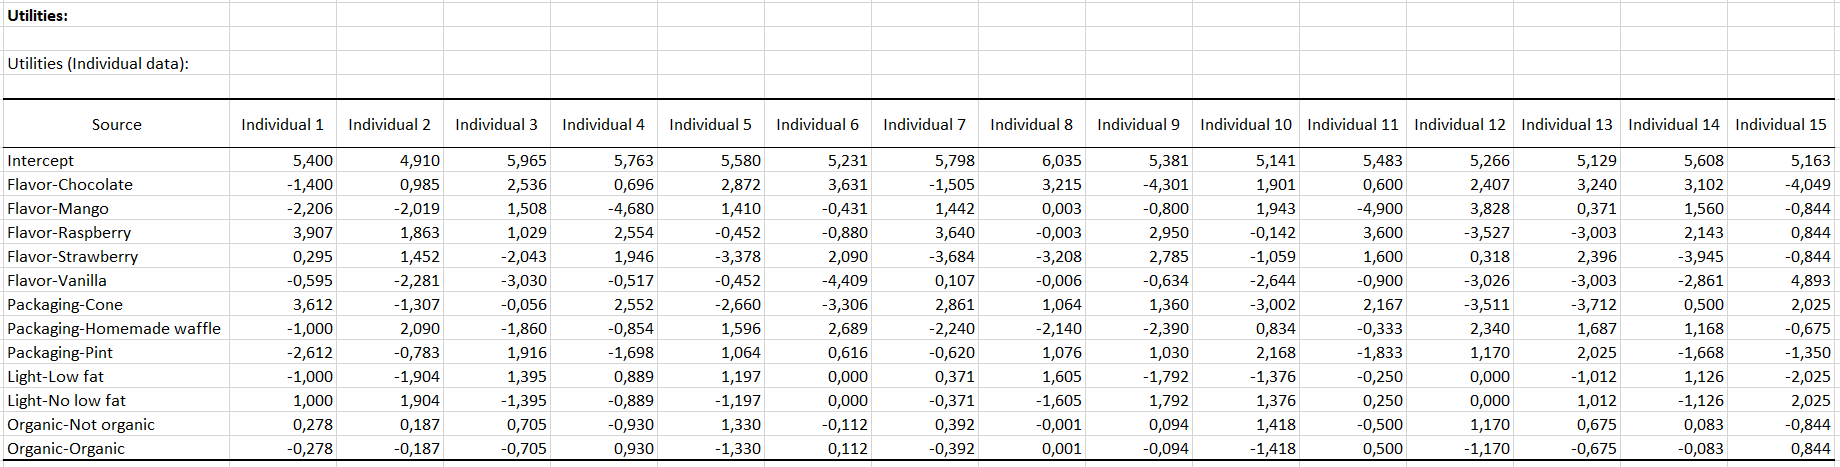
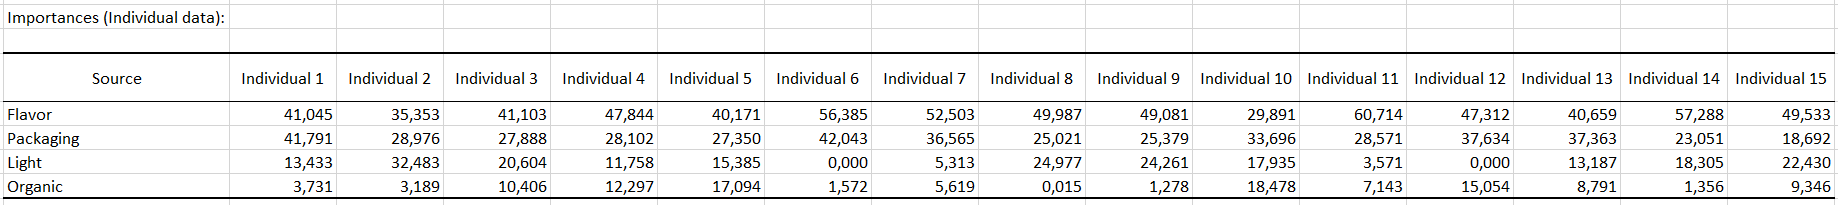
heir averages are calculated and displayed on charts. These give an idea of the importance of each factor.
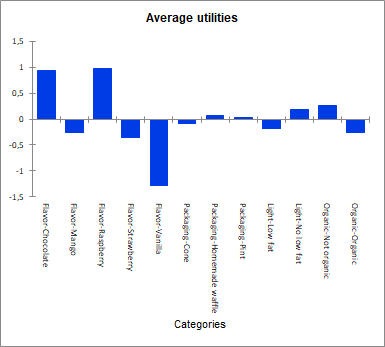
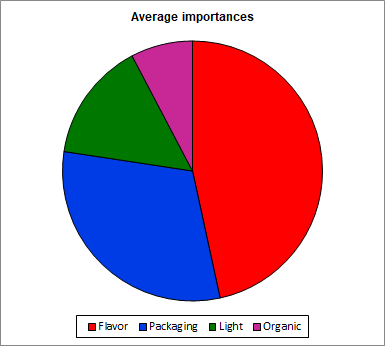 We can conclude that flavor and packaging are the most important factors both at the individual level and the average level. More specifically, chocolate or raspberry flavor and homemade waffle packaging have a largely positive effect (average utilities graph).
XLSTAT-Conjoint allows to segment respondents by using statistical clustering methods. This option allows to see if homogeneous groups of individuals emerge.
We can conclude that flavor and packaging are the most important factors both at the individual level and the average level. More specifically, chocolate or raspberry flavor and homemade waffle packaging have a largely positive effect (average utilities graph).
XLSTAT-Conjoint allows to segment respondents by using statistical clustering methods. This option allows to see if homogeneous groups of individuals emerge.
Running a Market simulation with XLSTAT
The main advantage of conjoint analysis is that it allows to simulate a market even if the products in the market have not been tested by the individuals.
In our case, the market for an ice cream is analyzed and we would like to know the impact and market shares associated with a new product (named Product 4). This product is an organic raspberry ice-cream which is not low fat and served in a homemade waffle. We know that in today's market there are 3 ice-cream that have different characteristics, the following table shows the simulated market:
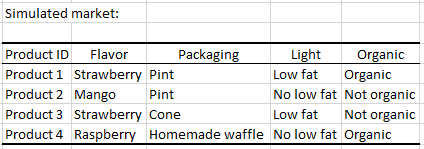 This table will be needed for the market share simulation. In order to easily create this table, you can use the Market generator tool as follow:
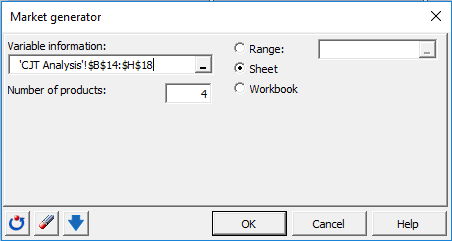
 To generate the market table containing the different products, you need to select the Variable information table displayed on the CJT Analysis sheet and indicate the number of products you want to generate. Then click OK.
 A new window pops up asking to choose the characteristics of each product. When a product has been defined, you can either continue to the next one or stop building the table. Usually, the new product we want introduce to the market is the last one. In our case, this is Product 4.
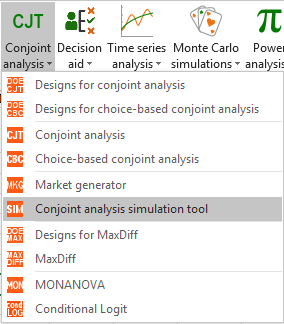
After the market generation, you can start the simulation. To do that, click on CJT / Conjoint analysis simulation tool.
A new window pops up asking to choose the characteristics of each product. When a product has been defined, you can either continue to the next one or stop building the table. Usually, the new product we want introduce to the market is the last one. In our case, this is Product 4.
After the market generation, you can start the simulation. To do that, click on CJT / Conjoint analysis simulation tool.
 You can then select the data.
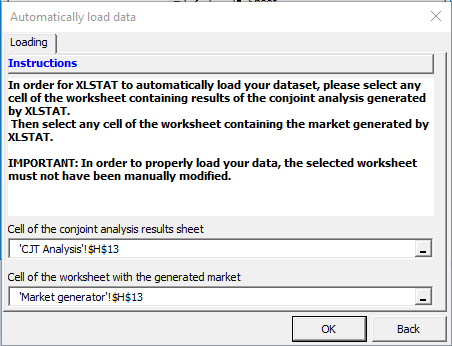
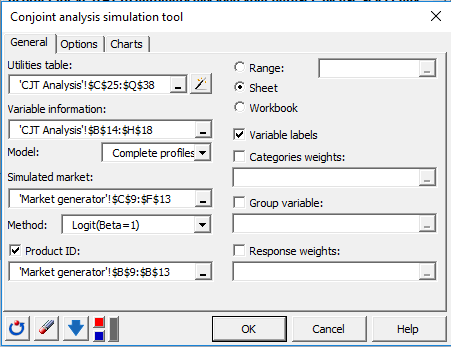
 In order to facilitate data selection and avoid to manually select the four datasets required (Utilities, Variable information, Simulated market, Product ID), click on the magic stick. This will automatically load the four datasets if the conjoint analysis and the simulated market have been generated with XLSTAT and if the two worksheets have not been manually modified (addition of rows or columns…). Then select any cell of the sheet containing results of conjoint analysis and any cell of the worksheet containing the market generated with XLSTAT. In this example, we select the cells H13 of the CJT Analysis and Market Generator sheets. Then click OK.
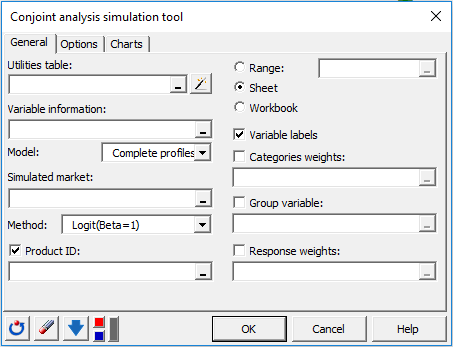
 You can also select your data manually: Utilities can be found in the CJT Analysis sheet; the table of information about variables is obtained in the CJT analysis sheet. The simulated market is on the Market generator sheet (do not select the names of products). You can also select the name of the product just behind the Product ID button. Select the Full profile model and the logit method for simulation.
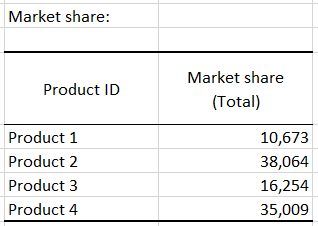
 Once you click on the OK button, the calculations are performed and the results are displayed.
The table shows that the market share for the new product (product 4) is almost 40%. This result seems satisfactory in order to launch the product on the market.
Once you click on the OK button, the calculations are performed and the results are displayed.
The table shows that the market share for the new product (product 4) is almost 40%. This result seems satisfactory in order to launch the product on the market.
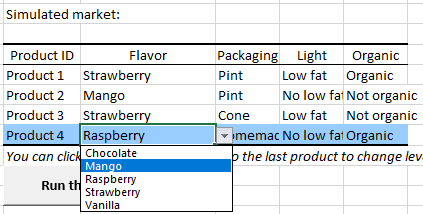
 In order to quickly evaluate the impact of other changing on the new product (you may want to know what would be the market share if the flavor of the new product is mango instead of raspberry), you can modify the categories of the last product (blue row) in the Simulated market table by clicking on the categories you want to change.
 Once the categories are modified, you can click on the Run again button (just below the simulated market table). Market shares and associated charts will be automatically updated.
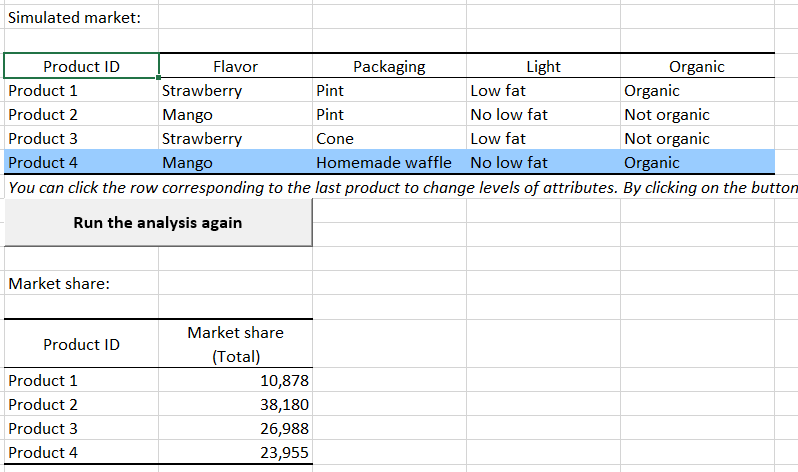 We can see in this example that market share slightly decreased with the mango flavor. So, it would be better to include a raspberry flavor in the new product.
Many more advanced analyses are possible with XLSTAT (use of segmentation variables, weights, use of statistical clustering methods...).
¿Ha sido útil este artículo?
- Sí
- No