Random Forest classification in Excel tutorial
This tutorial will help you set up and train a random forest classifier in Excel using the XLSTAT statistical software.
Dateset for setting up a Random forest classifier
The dataset used in this tutorial is extracted from the Machine Learning competition entitled "Titanic: Machine Learning from Disaster" on Kaggle the famous data science platform. It refers to the ocean liner the Titanic that sunk in 1912. During this tragedy, more than 1,500 of the 2,224 passengers lost their lives due to an insufficient number of lifeboats.
The dataset can be accessed at this address. It includes a list of 1309 passengers and their characteristics. These are:
-
survived: Survival (0 = No; 1 = Yes)
-
pclass: Passenger Class (1 = 1st; 2 = 2nd; 3 = 3rd)
-
name: Name
-
sex: Gender (male; female)
-
age: Age
-
sibsp: Number of Siblings/Spouses Aboard
-
parch: Number of Parents/Children Aboard
-
fare: Passenger Fare
-
cabin: Cabin
-
embarked: Port of Embarkation (C = Cherbourg; Q = Queenstown; S = Southampton)
The goal, here, is to set up and train a Random Forest classifier on the Titanic dataset.
Setting up a Random Forest Classifier in XLSTAT
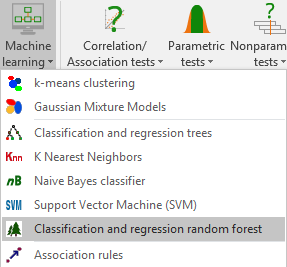
Once XLSTAT is open, select the XLSTAT/ Machine Learning / Random Forest Classifier and Regressor command as shown below:
The Random forest dialog box appears:
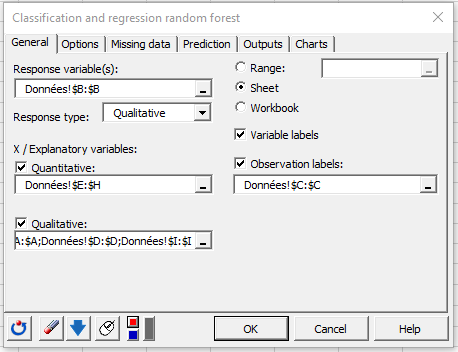
Select the variable **ppclass (column B) in the Response variable field. The ppclass represents the passengers’ class so the Response type here is Qualitative.
Then, select columns E-H as the Quantitative explanatory variables and the rest of columns as the Qualitative ones.
The variables names are provided in the first row of the data set, so we select the Variable labels.
Finally, select the passengers’ names (column C) as the Observation labels.
In the Options tab, set up the classifier parameters as following:
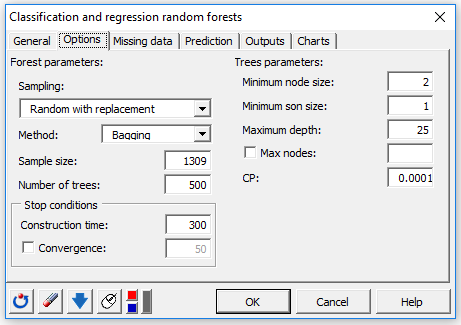
Here, we choose to use the Bagging method to build the trees.
The dataset includes missing values so we choose to remove these observations in the Missing data tab.
In the Outputs tab, select the below outputs:
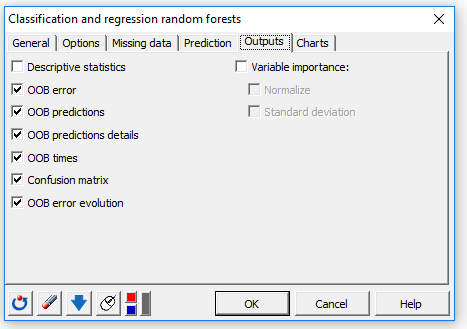
In the Charts tab, activate the OOB error evolution option to display the OOB (Out Of Bag) error evolution according to the number of trees built.
The computations begin once you have clicked on OK.
Interpreting the results of a Random Forest Classifier
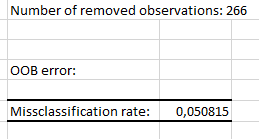
The first output is the OOB error rate of the random forest. It corresponds to the average classification error committed on each OOB sample of the training set. We call OOB sample, the sample made up of all the Out-Of-Bag observations. More details are available in the Help menu.
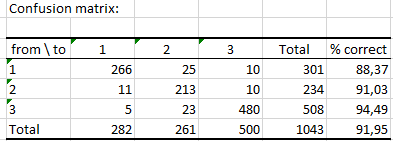
The next table displays the confusion matrix. That matrix tells us how well our classifier performed (predictions based on Out-Of-Bag data). Here, the algorithm predicted correctly 91.95% of observed classes.
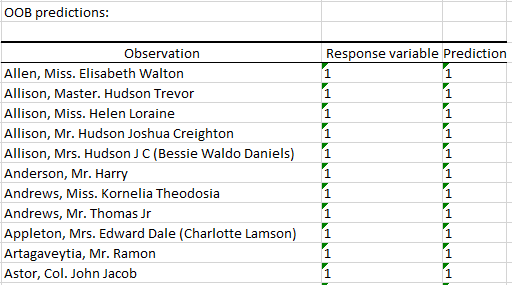
The second table displays the predicted class for each observation of the training set when the latter is Out-Of-Bag.
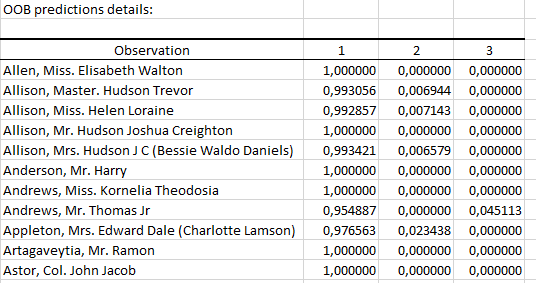
The next table contains for each observation the probability to belong to the different category of the response variable (based on the Out-Of-Bag data).
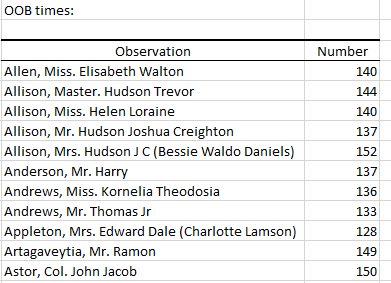
The number of times observations are ‘out-of-bag’ (and thus used in computing OOB error estimate) is also displayed:
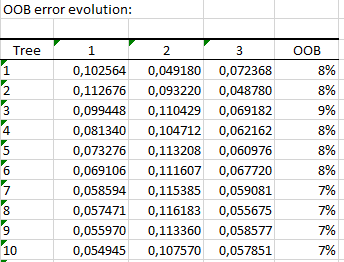
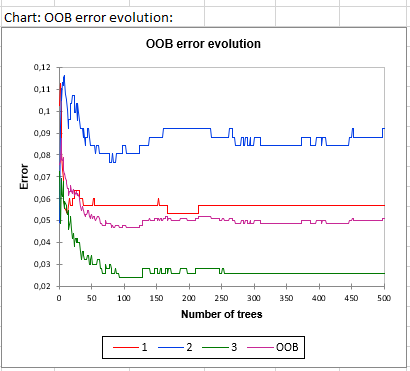
The last table presents the evolution of the OOB error rates according to the number of trees. The i-th element being the OOB error for all trees up to the i-th.
A graphical representation of the above table is given below:
Going further :
Click here to check out our tutorial on Random Forest regression using XLSTAT!
War dieser Artikel nützlich?
- Ja
- Nein