Faktorielle Versuchspläne in Excel - Anleitung
This tutorial will help you design and analyze a screening design in Excel using the XLSTAT statistical add-on software.
Dataset for the analysis of a screening design
The data come from a classic example of a catapult, which is frequently used in training on experimental design. It is described for example in [Louvet, F. and Delplanque L. (2005). Design Of Experiments: The French touch, Experimental plans: a pragmatic and illustrated approach, Alpha Graphic, Olivet, 2005].
Goal of this tutorial
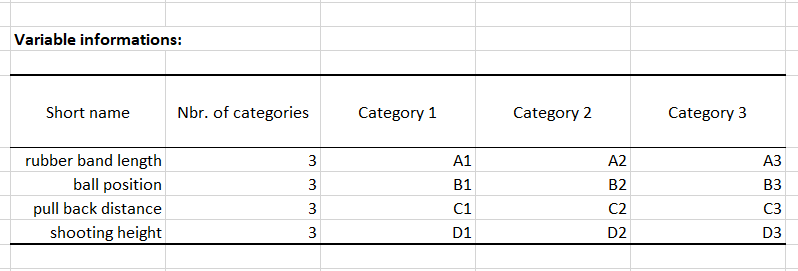
The goal here is to analyse 4 factors having an effect on the distance to which the projectile launched by the catapult is sent. These factors are: the length of the rubber band (A1, A2 and A3), the ball position (B1, B2 and B3), the pullback distance (C1, C2 and C3) and the shooting height (D1 , D2 and D3). Once the design was generated, the shooting distances were tracked down. Our aim then is to study the effect of each factor.
We use the XLSTAT screening designs for the design generation for the XLSTAT ANOVA for the analysis part. The effects of the factors on the response variables are assessed using ANOVA and the charts of the means.
Setting up the dialog box for generating a screening design
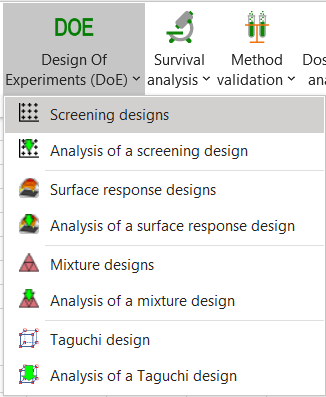
After launching XLSTAT, click the DOE button on the ribbon and select Screening Sesigns.
The Screening designs dialog box pops up.
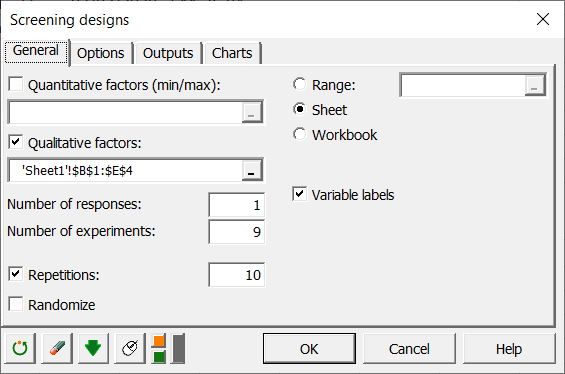
In the General tab, select the table of qualitative factors, the number of responses (1), the number of experiences (9) and the number of repetitions (10).
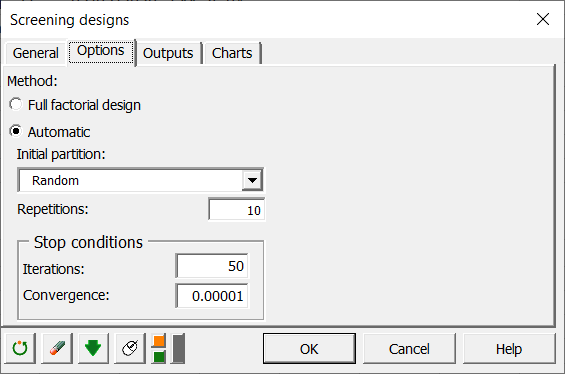
In the Options tab, leave the default options. Click on the OK button to start the computations.
A new dialog box pops up showing the proposed orthogonal designs coming from the internal database and which are closely related to the problem. The designs which have a distance of 0 are exactly adapted to the desired design. In our case, it is the Latin Square and it is therefore not necessary to search for another experimental design by optimization. Select the Latin Square design by clicking on the "Select" button.
Output of the experimental design
A table with all the information related to the factors is displayed.
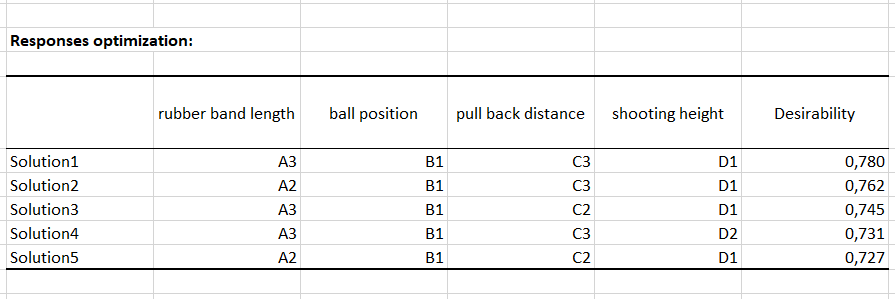
Then the design is displayed, in which the last column corresponds to the response results and must be filled with the results of the experiments. Below, the response optimization table is displayed and will be automatically filled after entering the response results.
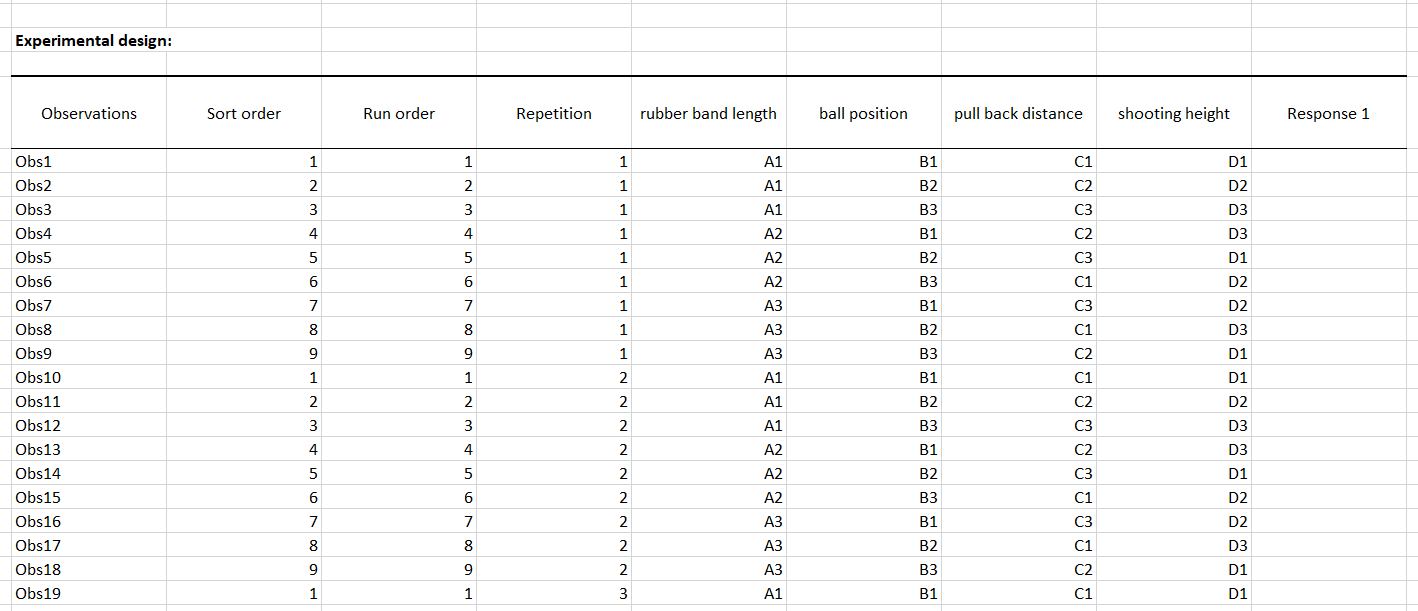 Let's suppose that the experiments are carried out and the results are entered in the appropriate column of experimental desig table.
Select the option to maximize the response in the optimization table, which will find the best combination of factors allowing the catapult to launch the projectile the farthest.
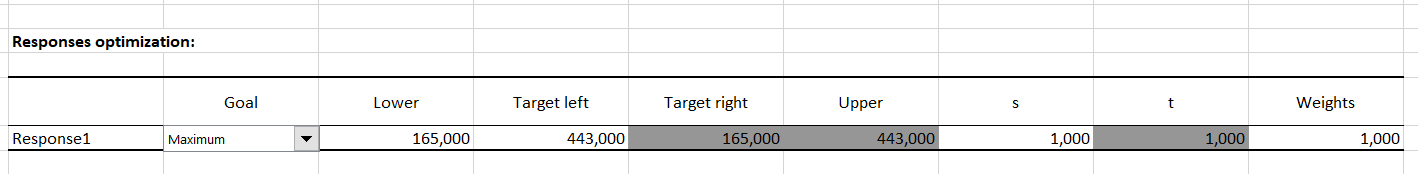
In the demo file used for this tutorial, the results are already present, they have been highlighted in yellow to identify them quickly.
Setting up the dialog box for the analysis of a screening desing
You have two options to analyse the design.
- The first is simply to click on the button "launch the analysis" located below the design table. This way, the a pre-configured dialog box will open ready to launch the computations.
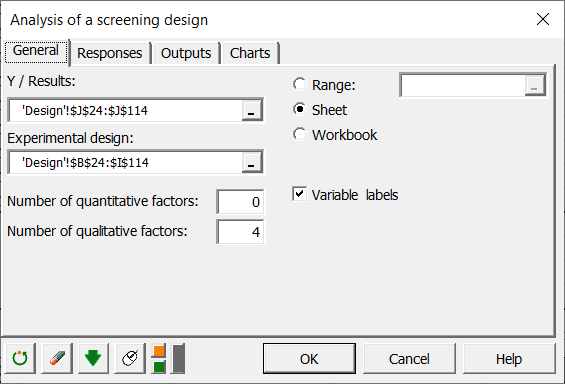
- The second is to click on the DOE button on the ribbon and select "Analysis of a screening design". The dialog box will pop up. Select, in the general tab, the column with the results of the experiments as well as the experimental design table. Be careful to select all the design columns (see below).
In the Options tab, check the response optimization option and select the associated table in the design sheet.
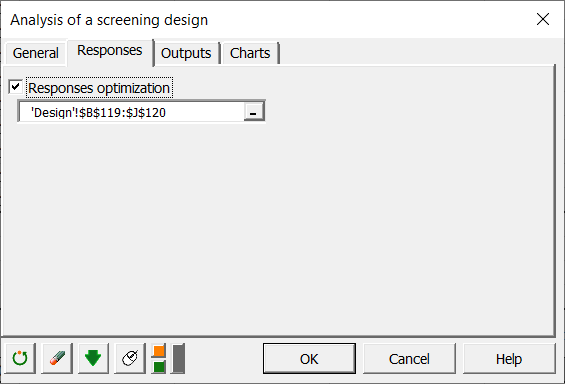
Once you have clicked on OK, the computations start.
Interpreting the results of a screening design analysis
A first table is displayed, providing a summary of the responses optimization. This one shows us directly that the combination allowing to maximize the distance at which the projectile is launched by the catapult is the following: A3, B1, C3, D1.
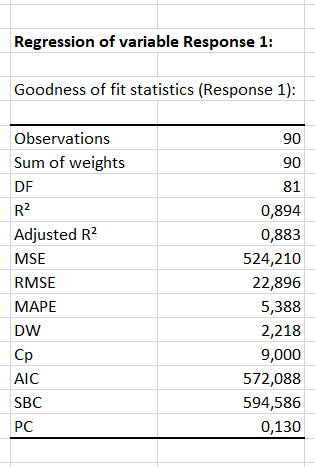
Then all the results of the analysis of variance are displayed, starting with the goodness of fit coefficients. We can see that the R² = 0.894, which shows that the ANOVA describes the data very well.
If we then look at the means charts, we can quickly notice that we find the same results as the optimization. The means for which the distance is the greatest are associated with the factors A3, B1, C3 and D1.
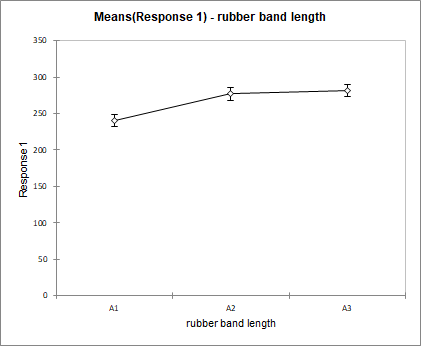
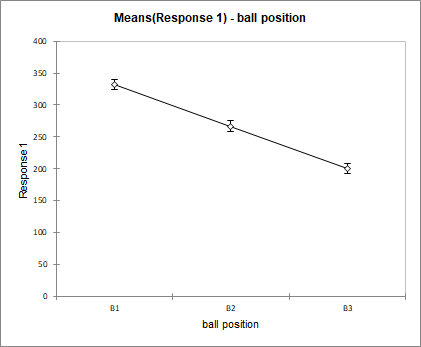
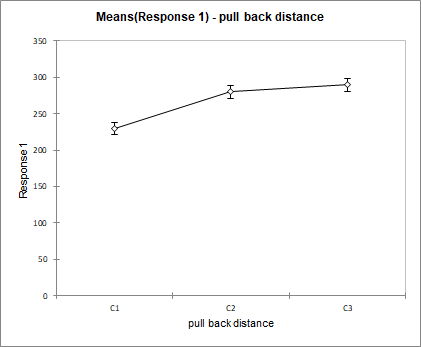
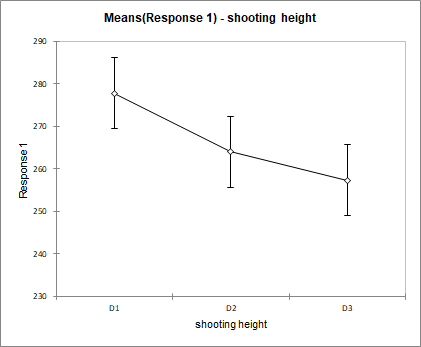
These charts show the effect of each factor on the launch distance of the projectile. For a given factor the mean distance for each of its categories is displayed and connected by a line. The factor with the highest variation has the biggest effect. In this example it is the factor ball position with a distance varying between 331 for B1 and 200 for B3. The smallest effect is for the factor shooting height with 277 for D1 and 257 for D3. Using repeated measurements for each of the categories, once can compute mean confidence intervals.
To sum up, the shooting height factor has low influence compared to the other factors and can be taken out of the analysis. The ball position factor should be analysed in a closer way in order to find the optimal position. This could be done, for instance, together with the two other factors rubber band length and pull back distance in a surface response experimental design.
War dieser Artikel nützlich?
- Ja
- Nein