Easy fit - Select the best fitting model in Excel
This tutorial explains how to quickly fit different models and make predictions in Excel with XLSTAT.
Purpose of the Easy Fit function
Use the Easy Fit function to test and compare different predictive models on the same dataset. Depending on the type of variable to be predicted (quantitative or qualitative) and the type of explanatory variables, different predictive models are proposed. The Easy Predict function then allows you to predict new observations values on previously generated models.
This tutorial shows how to generate and select several classification models (where the variable Y to predict is qualitative). The Easy Fit function allows, in the same way, to deal with regression models (where the variable Y to predict is quantitative).
The table below shows the different predictive models currently available in the Easy Fit function depending on the nature of the Y variable to predict and on the nature of the X explanatory variables:

Dataset for selecting predictive classification models
The dataset is taken from the Machine Learning competition entitled Titanic: Machine Learning from Disaster on Kaggle, the data science platform. It refers to the sinking of the Titanic in 1912. During this tragedy, more than 1,500 of the 2224 passengers died in part because of an insufficient number of survival boats.
The dataset consists of a list of 1309 passengers and their characteristics:
The qualitative variable Y to predict:
SURVIVED: 0 = No; 1 = Yes
3 qualitative explanatory variables:
PCLASS: Travel class (1 = 1st; 2 = 2nd; 3 = 3rd)
SEX: Gender (male; female)
EMBARKED: Embarkation port (C = Cherbourg; Q = Queenstown; S = Southampton)
4 quantitative explanatory variables:
AGE = passenger age
SIBS: Number of siblings/ spouses on board
PARCH: Number of parents/ children on board
FARE: Passenger fare
Goal of this tutorial
The purpose here is to predict the Y qualitative variable SURVIVED. We will use the Easy Fit function to generate several classification models and to select the best fitted model. Then we will apply the selected model to a new sample and make predictions.
Setting up the Easy Fit function in XLSTAT
Once XLSTAT is open, select the XLSTAT/ XLSTAT.ai / Easy Fit command as shown below:

The Easy Fit dialog box appears.

Choose the type of the Y variable to predict. In this case Y is qualitative and corresponds to the column A containing the SURVIVED variable.
Select the explanatory variables. Here, we have quantitative explanatory variables (columns E, F, G and H) and qualitative explanatory variables (columns B, C and D).
The Easy Fit function automatically proposes to fit 5 different models:
-
Logistic regression
-
Random forests
-
K nearest neighbors
-
Support vector machine (SVM)
-
Discriminant analysis
Once you have clicked the OK button, the calculations start, and the results are displayed.
Interpreting Easy Fit results
Data are always separated into two samples. 80% of the observations were used for model learning and 20% were used for model validation.
A summary table containing the quality measurements of generated models is displayed.
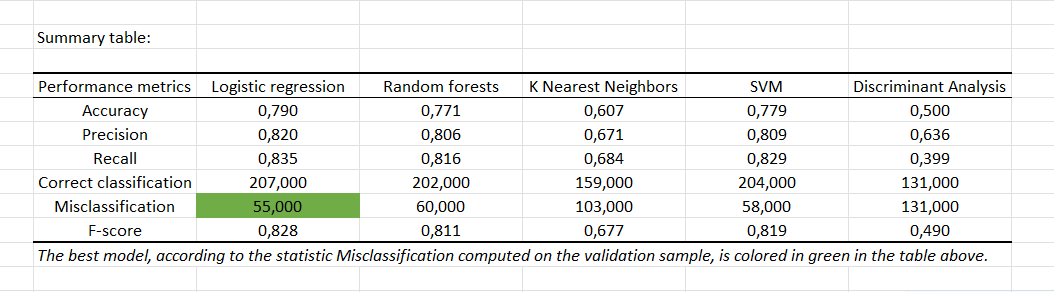
The best model on this dataset seems to be the logistic regression. Finally, synthetic results of the generated model are displayed. Indeed, this model gives the lowest number of misclassified observations.
At the start of the results of each model, two buttons are available:

The first button allows you to automatically restart the prefilled dialog box associated with the complete method. This can be very useful if you want to get more results than the synthetic results generated with Easy Fit.
The second button allows you to make predictions with the chosen model on new observations that were not used for model learning or validation. When you click on this button, the following dialog box appears.

Select the same explanatory variables but on a new sample to predict whether new passengers will survive or not.
Once you have clicked the OK button, calculations start, and results are displayed.
The results predicted with Easy Predict are displayed below:

Conclusion
We have seen through this tutorial how to use the Easy Fit function to generate several predictive classification models on the same dataset.
Synthetic results obtained allow us to evaluate the quality of the model. The addition of interactive buttons makes it possible to go further by relaunching the complete model. They also enable us to apply the chosen model to a new prediction sample.
This tutorial was done on a classification case (where the Y variable to predict is qualitative) but this feature can be also used on a regression case (where the variable Y to predict is quantitative).
Was this article useful?
- Yes
- No