Create a disjunctive table in Excel
This tutorial shows how to create a complete disjunctive table from a table of qualitative variables in Excel using the XLSTAT software.
Dataset for creating a disjunctive table
In this tutorial we will show how to create a disjunctive table from category variables.
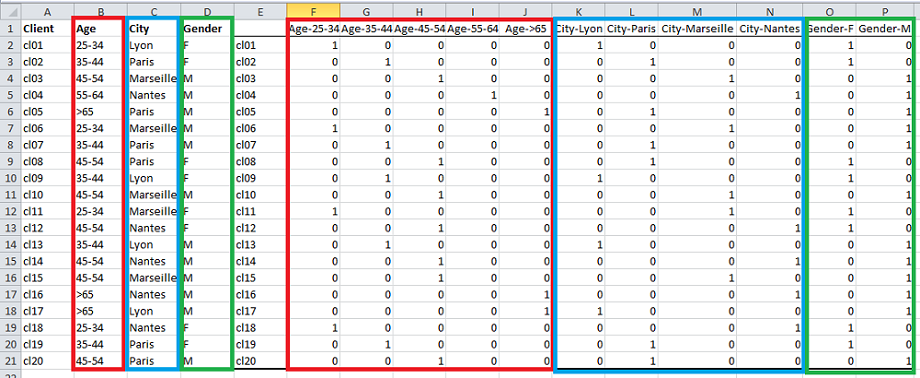
The dataset contains 20 clients with their age class, city of residence and gender. We will transform the variables Age, City and Gender into a disjunctive table. This means that we will split each category variable into corresponding binary variables (coded in 0 and 1).
Creating the disjunctive table
After opening XLSTAT, select the XLSTAT / Preparing data / Complete Disjunctive tables command, or click on the corresponding button of the Preparing data toolbar (see below).

Once you've clicked on the button, the dialog box appears. Select the category variables you wish to split. Select the variables Age, City and Gender by selecting the whole columns.
The output should be displayed in an appended table so tick the option Range and select the cell E1 to begin displaying the results.
The columns A, B and C contain variable labels so the option Variable labels should be ticked.
Moreover to avoid having text written above the results we deselect the option Display the report header.

Once you have completed the tasks click on the OK button.
Disjunctive table in XLSTAT
The results are now displayed next to the original variables. You can see the correspondence between the category variables and their disjunctive tables.
This video shows you how to reproduce those results.
Was this article useful?
- Yes
- No