Aggregating data in Excel
This tutorial will help you aggregate data in Excel using the XLSTAT statistical software.
Dataset for aggregating data in Excel with XLSTAT
The data represent the sales amount of a supermarket chain on a weekly basis. Columns A-B contain the month and the week associated with each sales record. Columns C-F contain the sales amount for each store location (South, West, East, and North).
Goal of this tutorial
Aggregation (or grouping) is a common task in database management. It allows to obtain summary statistics (e.g. mean, sum, max, etc.) of one or more quantitative variables by groups. Here, we want to obtain the total amount of sales per month for each store location.
Setting up a data aggregation with XLSTAT
-
Once XLSTAT is open, select the Data Management command under the Preparing data menu as shown below.

-
The Data management dialog box appears.
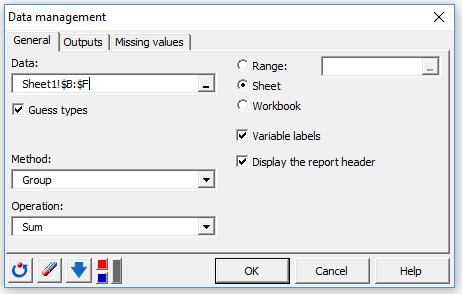
Select columns B-F from Sheet1 in the Data field. Then select the Group method and the Sum operation. Headers are also included in our data selection, so we check the Variable labels option.
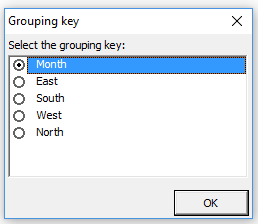
- Click on the OK button to select Month as a grouping key in order to compute the sum of sales amounts per month.
 Click on the OK button. The XLSTAT report will be generated in a new sheet named Group.
Results from data aggregation
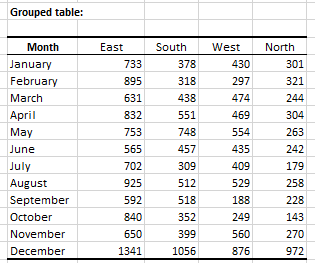
XLSTAT generates the grouped table below including the total sales amounts per month for each location.
Was this article useful?
- Yes
- No