MaxDiff analysis with multiple designs in Excel tutorial
This tutorial shows how to compute and interpret a MaxDiff analysis with multiple designs in Excel using the XLSTAT software.
MaxDiff analysis can be divided in four steps:
-
Choice of the relevant attributes to describe the products.
-
Generation of design of experiments based on incomplete block designs.
-
Collection of the results in Microsoft Excel sheets.
-
Data analysis with a specific method: Logit or Hierarchical Bayes.
In this tutorial, we will detail the necessary steps to generate a MaxDiff design as well as to run a MaxDiff analysis with XLSTAT.
Dataset to conduct a MaxDiff analysis
In this tutorial we will look at a simple case of MaxDiff analysis based on tourism marketing. A hotel brand wishes to open a new hotel and would like to understand the importance of attributes of a vacation destination in order to define its offer.
The results are divided into different sheets:
-
Attributes: This sheet contains the attributes selected to describe the products.
-
Designs for MaxDiff: This sheet contains the generated design, and the choices given by 5 respondents.
-
MaxDiff: This sheet contains the results of MaxDiff analysis by Hierarchical
Goal of this tutorial
The purpose of this tutorial is to identify the most important criteria for travelers when choosing a touristic destination using MaxDiff analysis. The steps of the analysis are presented below:
Step 1: Choosing the attributes
The first step in this MaxDiff analysis is done in collaboration with experts in tourism market. We focus on choosing the important attributes to define a touristic destination. The selected attributes are:
-
Quality beaches
-
Cultural activities
-
Nightlife
-
Luxury hotel offer
-
Shopping around
-
Entertainment
-
Wildlife around
-
Local cuisine
Among these attributes, we want to evaluate which ones are the most important for tourists. MaxDiff will present sets of attributes to respondents. In every set, respondents are asked to choose which attribute is the most important to them and which one is the least important.
Step 2: Generation of the comparisons
XLSTAT allows you to create sets of attributes to be compared by the respondents. A design of experiments method is used.
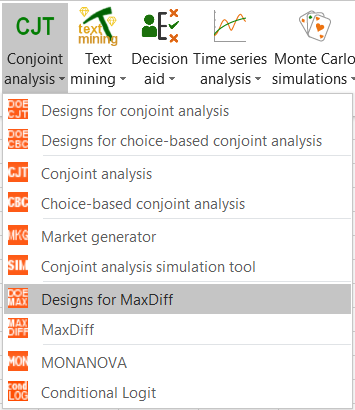
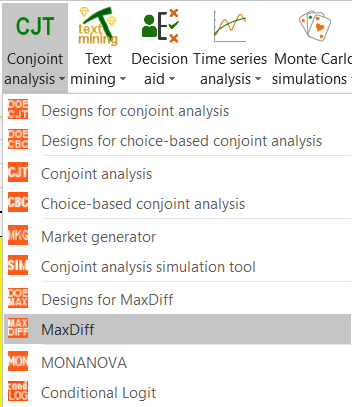
Once XLSTAT is started, click on the CJT icon and choose the Designs for MaxDiff analysis feature.
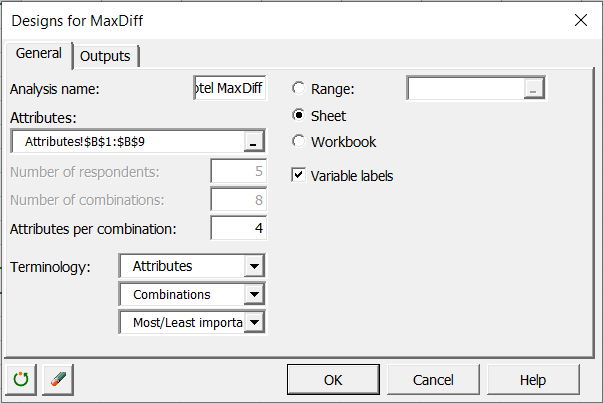
Once the button is clicked, the dialog box appears.
You can then enter the name of the analysis, select the attributes names, enter the number of comparisons (8) and the number of profiles per comparison which corresponds to the size of each set of attributes (4). These values have to be chosen by the user so that the dataset that will be collected is big enough to obtain significant results, while not being too long to let the respondents stay focused throughout the questionnaire.
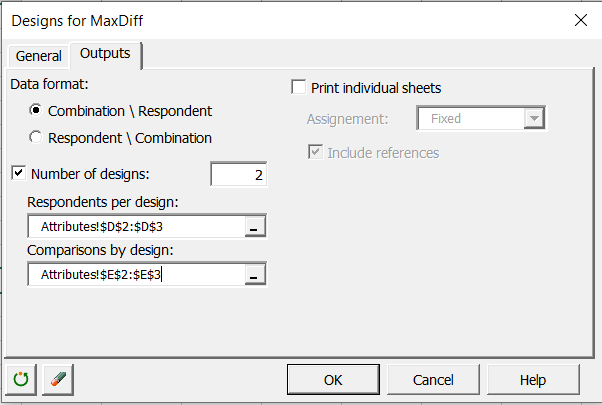
In the Outputs tab, we choose the Combination / Respondent format, which means combinations will be in rows while responses of respondents will be in columns.
We choose to generate 2 different designs and we select the number of respondents and comparisons per plan. This allows to have a number of different combinations greater than with a single plan and reduce the psychological impact of respondents.
Once you click the OK button, the computations are run, then the results are displayed.
The main table is the table of choice, displayed in the Designs for MaxDiff sheet and must be completed after the individuals (respondents) have been interviewed. Choices are between 1 and 4 for each individual. There are two columns per individual, one for the most important attribute (best) and one for the least important attribute (worst).

Step 3: Fill in the MaxDiff analysis table
The MaxDiff analysis tables can either be filled in directly after interviewing individuals about their choices externally, or directly using the individual sheets and automatic referencing of results. This is especially interesting in the context of MaxDiff analysis because completing the overall table can be complex.
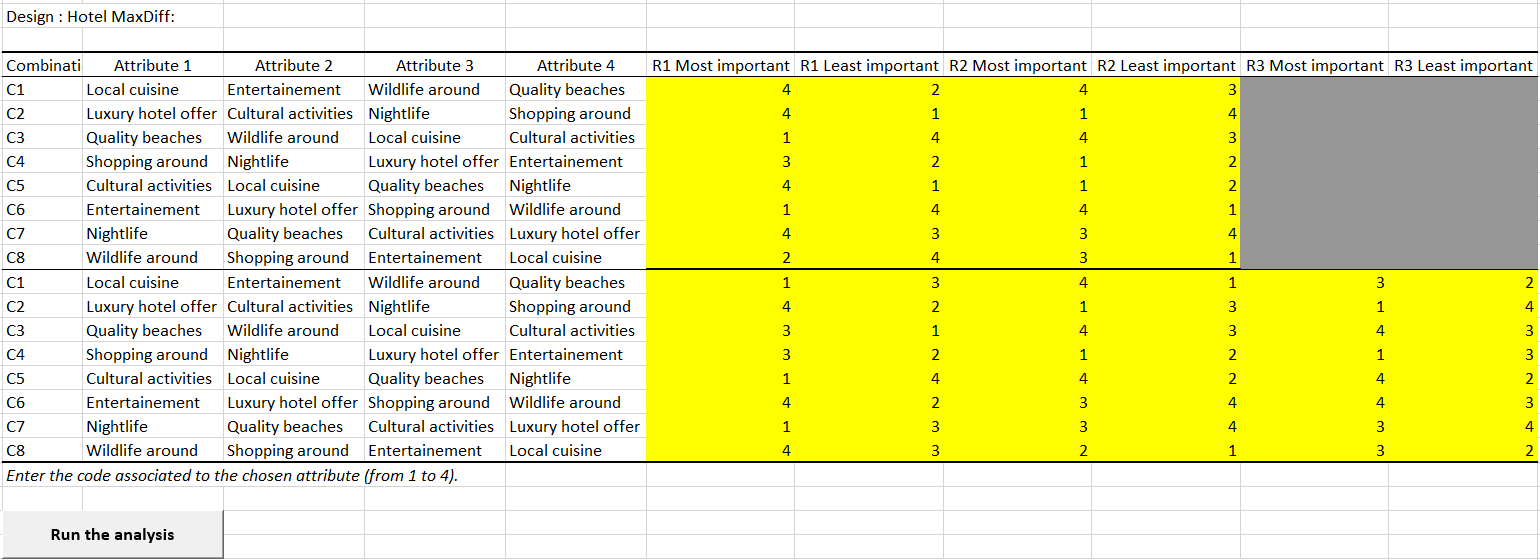
In our case, individual 1 thinks Entertainment is the most important attribute and having wildlife around is the least important within the 4 presented attributes in the first set or combination.
Step 4: Carry out the MaxDiff analysis
As part of this analysis, 5 individuals have been asked about their preferences in terms of touristic destination. The results are available in the MaxDiff sheet.
Once the MaxDiff design is filled with the responses, you are ready to run the analysis. One option is to click on the button Run the analysis which automatically launches the interface with the loaded data.
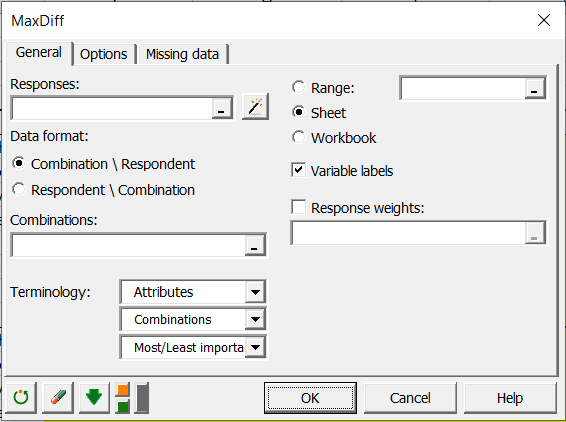
Alternatively, you can click on the CJT icon and choose the MaxDiff feature.
You can then select the data.
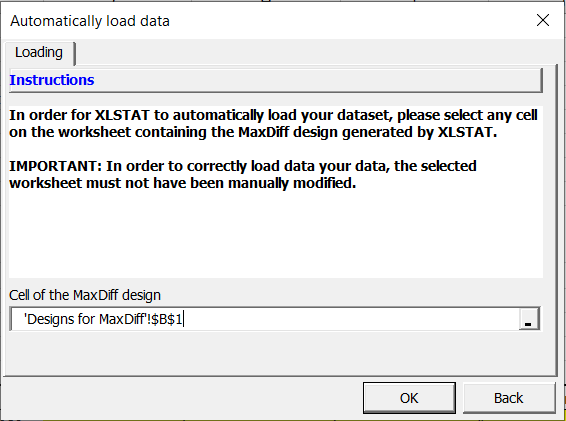
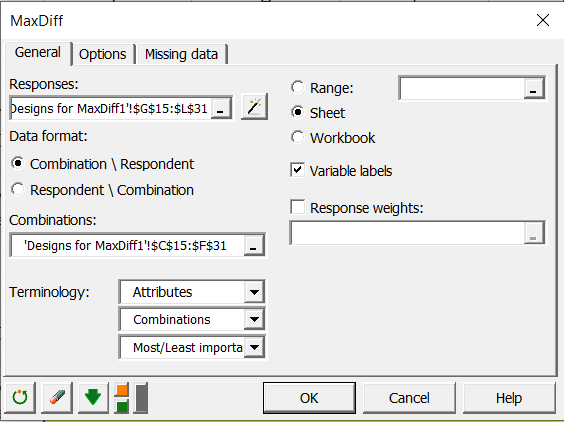
To facilitate data selection and avoid to manually select the two required datasets (Responses and Combinations), you can click on the magic stick. This will automatically load the two datasets if the MaxDiff design has been generated with XLSTAT and if you did not manually modify the worksheet containing the design. A new window will pop up. Select any cell of the worksheet containing the MaxDiff design generated with XLSTAT. In this example, we selected the B1 cell of the Design for MaxDiff sheet. Then click on OK.
You can also select your data manually. In the Responses field, select the 10 columns of the table of responses provided by the respondents. In the table of choices, select the four columns of the attributes.
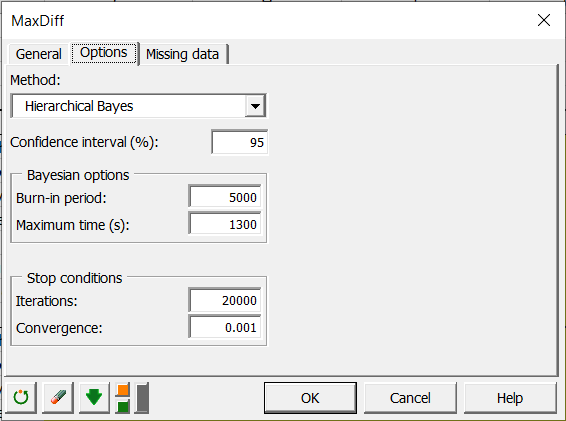
In the Options tab, we select the Hierarchical Bayes method and we leave all the other values as default. Hierarchical Bayes analysis can take time to output results. If you want to conduct a simpler and faster analysis, you can only select the counts' analysis in the Outputs tab.
Once you click the OK button, the computations are performed, and the results are displayed.
Interpreting a MaxDiff analysis
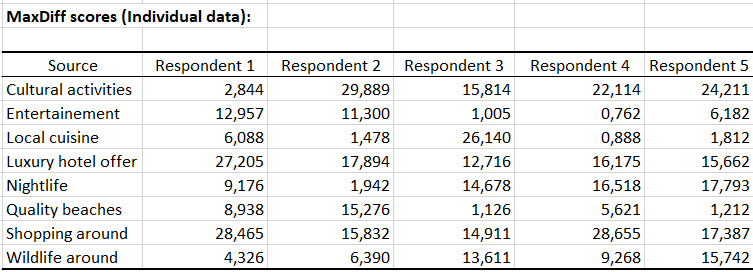
The MaxDiff scores are displayed as rescaled coefficients summing up to 100. We see that Individual 1 considers shopping around and luxury hotel offer as very important factors. Entertainment is also important but to a lesser extent.
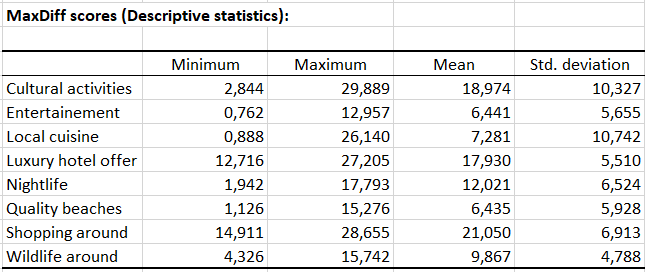
Descriptive statistics are also shown. If we check the Means column, we see that shopping around, cultural activities and luxury hotel offer are the most important attributes on average.
We can visualize average MaxDiff scores on the chart below.
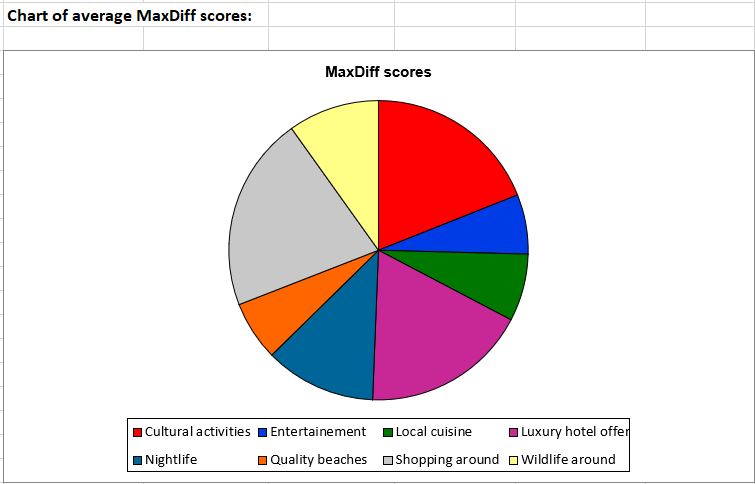
After this preliminary study, we may suggest that the hotel chain should focus on luxury hotels with shopping possibilities and cultural activities.
Was this article useful?
- Yes
- No